
"A Tool for Financial Warfare" Indicator - Complete Guide
"Dominate the Markets with Precision – Turn Volatility into Victory!"
🔹 Overview
"A Tool for Financial Warfare" is a powerful MetaTrader 4 (MT4) indicator based on the RSX (Relative Strength eXplosion) oscillator. It helps traders identify overbought/oversold conditions, trend direction, and potential reversals with high accuracy.
This indicator is designed for aggressive traders who want to capitalize on momentum shifts and extreme market conditions.
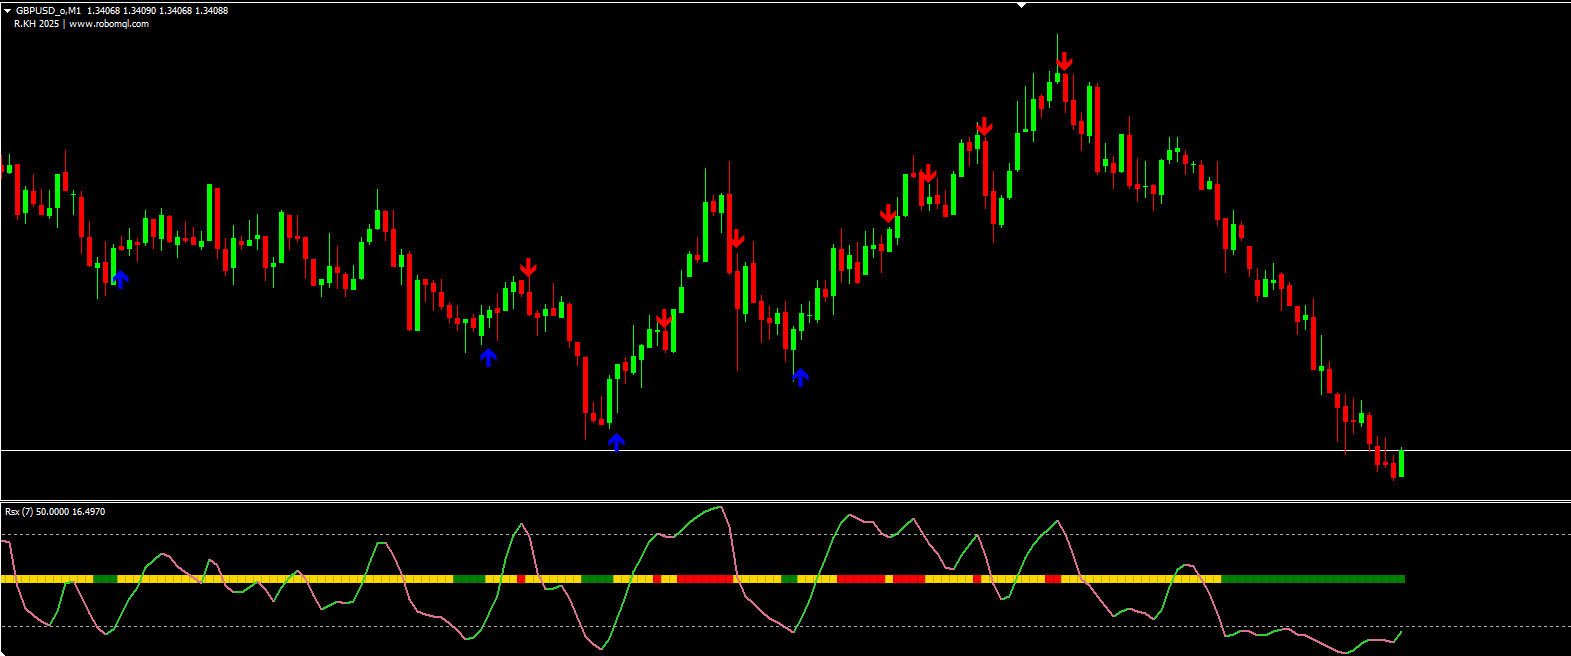
🔹 How It Works
The indicator calculates the RSX oscillator, a smoothed momentum-based indicator that filters out market noise. It provides:
Overbought/Oversold Zones (Customizable levels)
Trend Direction Signals (Up/Down arrows)
Slope Changes (Momentum shifts)
Zone Entry/Exit Alerts (For timely trade execution)
Key Features:
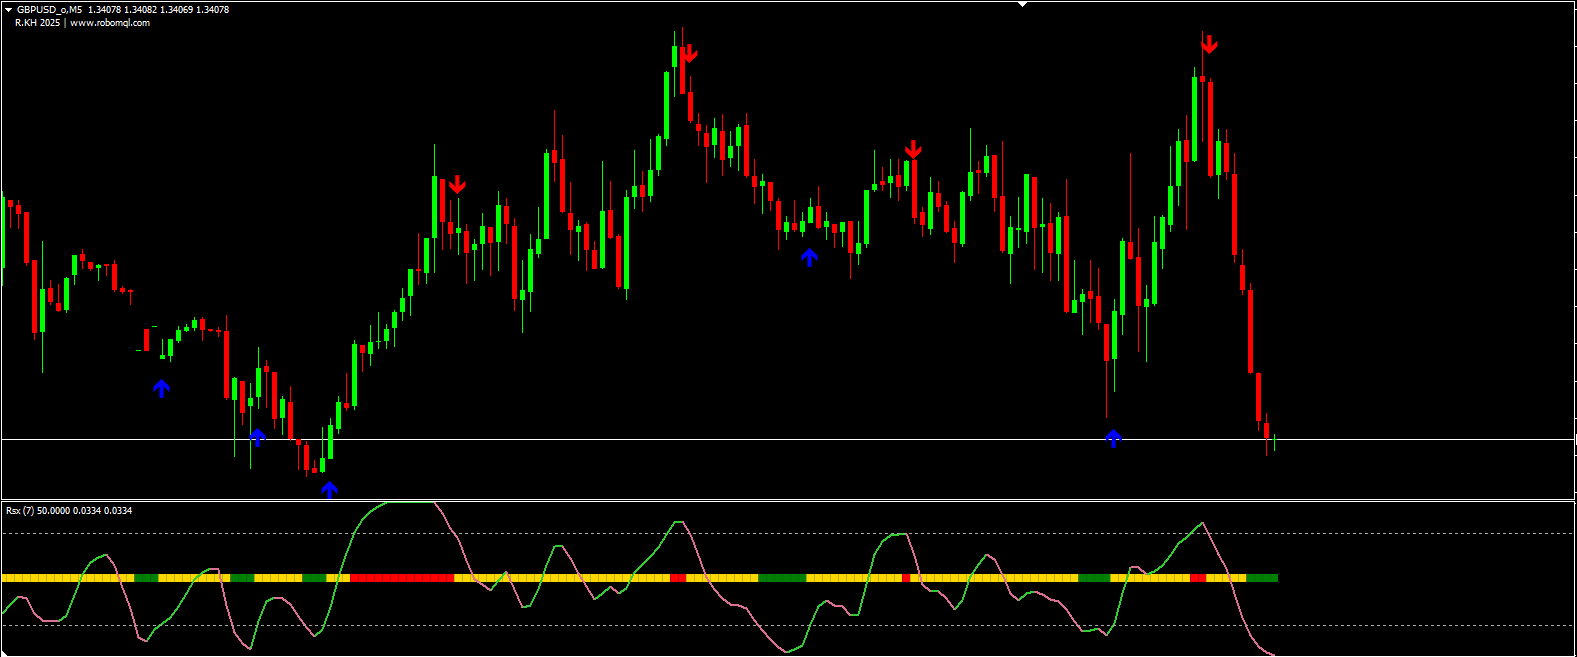
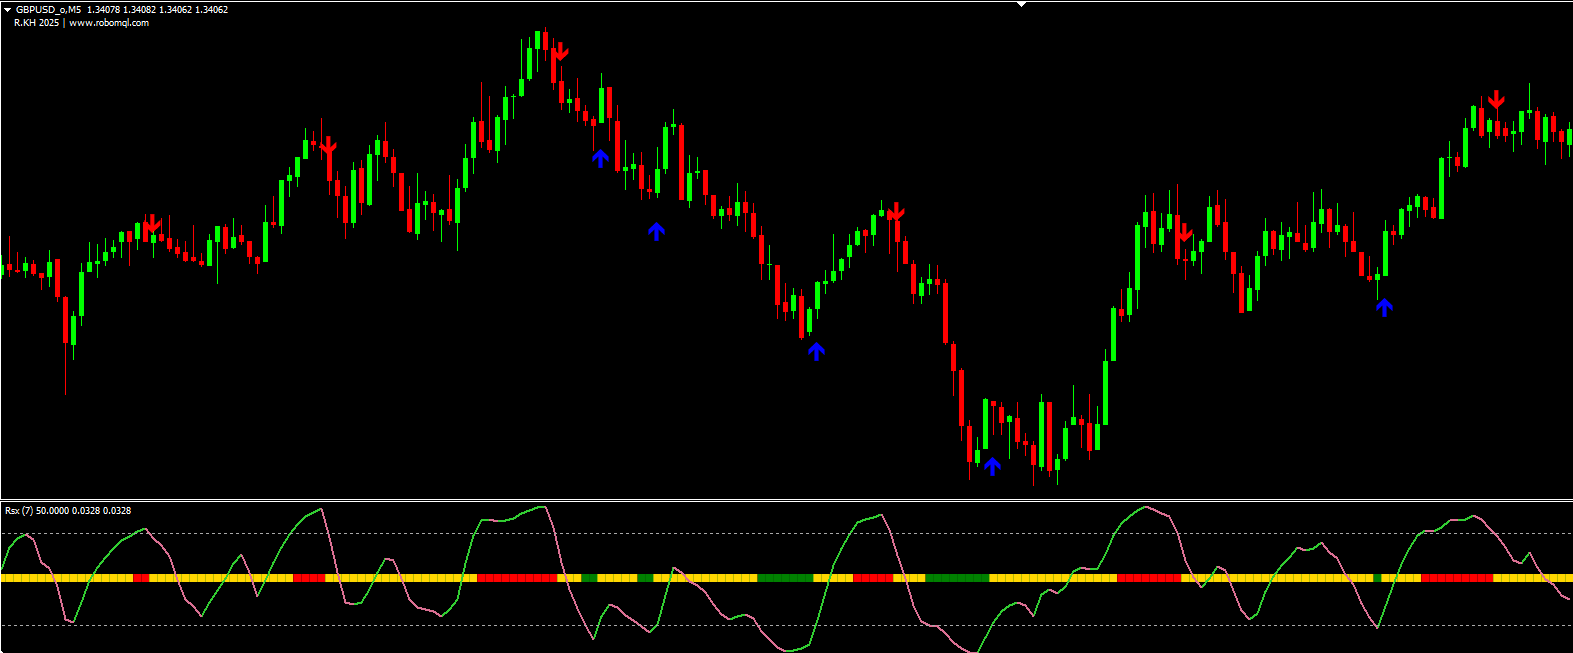
✅ Multi-Timeframe Analysis – Works on any chart timeframe.
✅ Customizable OB/OS Levels – Adjustable thresholds (default: 20/80).
✅ Multiple Alert Systems – Desktop, email, push notifications.
✅ Visual Arrows – Clear entry/exit signals.
✅ Heiken Ashi Compatibility – Can be used with smoothed candles.
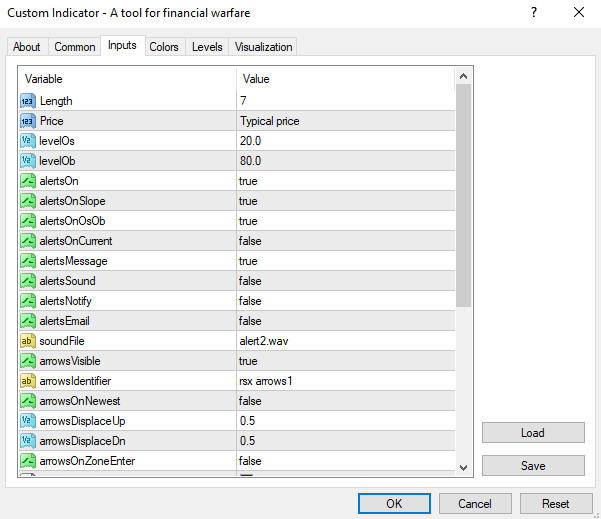
🔹 Indicator Settings & Parameters
1. Main Inputs
Length (7) – Smoothing period for the RSX calculation.
Applied Price (PRICE_TYPICAL) – Price type used for calculations (Close, Open, Typical, etc.).
Level OS (20) – Oversold threshold.
Level OB (80) – Overbought threshold.
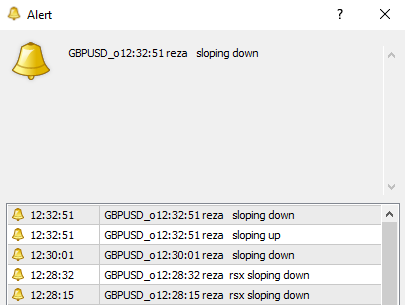
2. Alert Settings
Alerts On (True/False) – Enable/disable all alerts.
Alerts on Slope Change – Notifies when momentum shifts.
Alerts on OB/OS Zone Entry/Exit – Warns when price enters/exits overbought/oversold areas.
Desktop, Email, Push Notifications – Customizable alert methods.
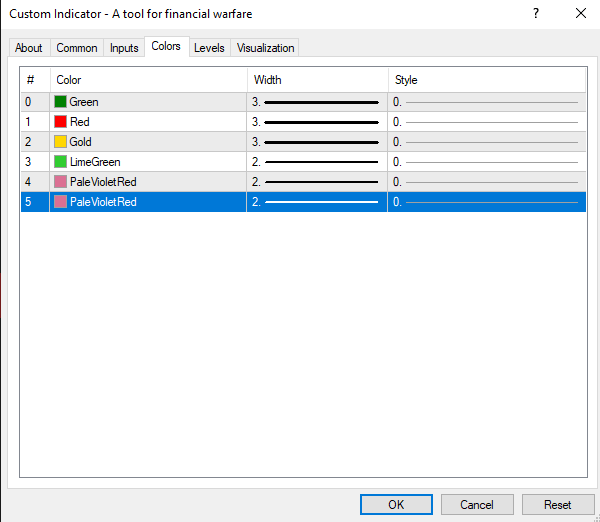
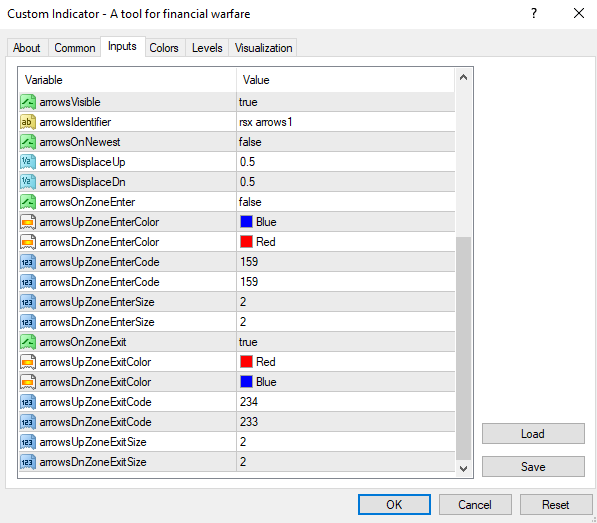
3. Arrow Display Settings
Arrows Visible (True/False) – Toggle arrows on/off.
Arrows on Zone Entry/Exit – Different colors for entering/exiting OB/OS zones.
Arrow Size & Style – Customizable appearance.
🔹 Trading Signals & Interpretation
🔸 Buy Signals (Long Trades)
RSX crosses above Oversold (20) + Slope turns upward → Potential reversal.
Blue Up Arrow → Strong bullish momentum.
🔸 Sell Signals (Short Trades)
RSX crosses below Overbought (80) + Slope turns downward → Potential reversal.
Red Down Arrow → Strong bearish momentum.
🔸 Additional Confirmation
Trend Continuation – If RSX stays in mid-range (20-80), follow the slope direction.
Divergence – If price makes higher highs but RSX makes lower highs → Possible reversal.
🔹 Recommended Trading Strategy
Wait for Extreme Zones – Enter trades when RSX hits OB (80) or OS (20).
Confirm with Slope – Ensure momentum aligns with the trade direction.
Use Stop Loss – Place stops beyond recent swing highs/lows.
Combine with Trend Filters – Use moving averages or price action for stronger confirmation.
🔹 Developer & Source
Developer: R.KH
Year: 2025
Website: https://www.robomql.com
"Trade Like a Strategist – Win the Financial War with RSX!" 💹🔥