
Accurate Daily Identification Indicator - Professional Session Analyzer
Overview
The Accurate Daily Identification indicator is a sophisticated MT4 tool that visually marks key trading sessions and price ranges on your chart. It helps traders identify:
Daily high/low ranges (or open/close ranges)
Important trading sessions (Asian, European, US)
Breakout zones with alert capabilities
Key Features
✅ Customizable Session Markers - Visually separates trading sessions with colored rectangles
✅ Dual-Period Analysis - Tracks both initial (Period A) and extended (Period B) price ranges
✅ Breakout Alerts - Configurable alerts when price breaks key levels
✅ Multi-Day Display - Shows up to 50 days of historical ranges
✅ Flexible Time Settings - Adapts to different timezones and session hours
How It Works
The indicator creates several visual elements:
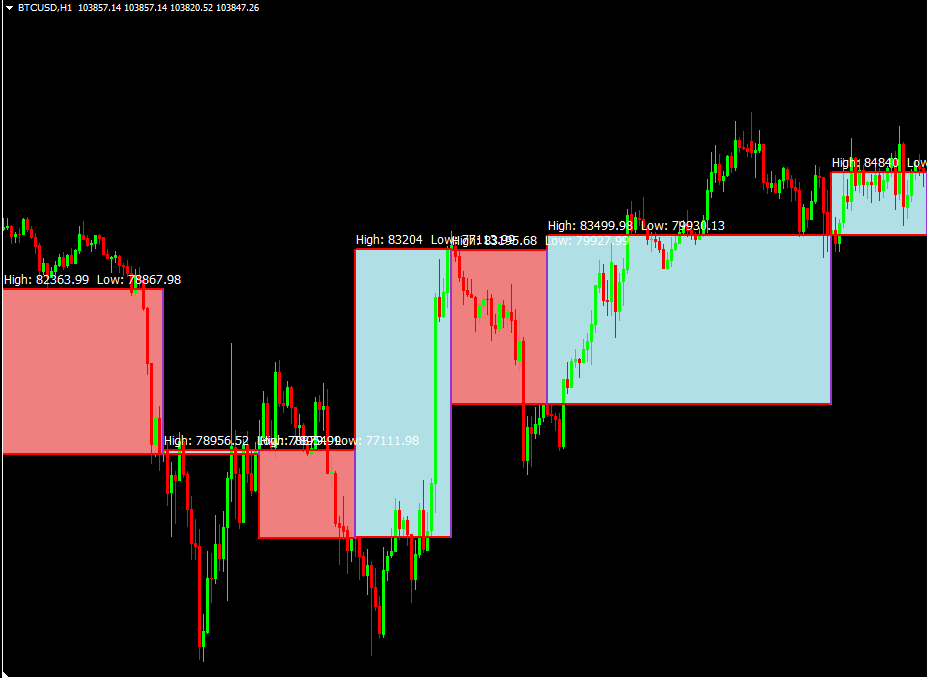
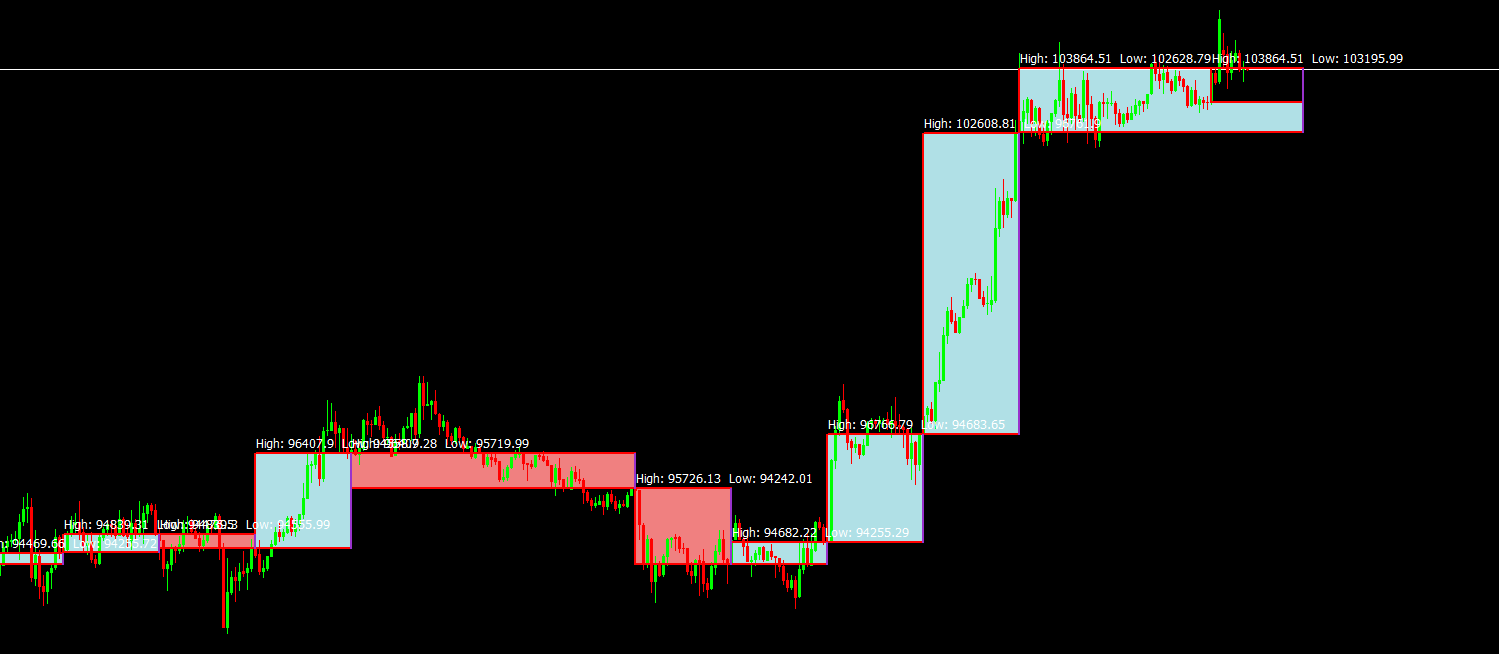
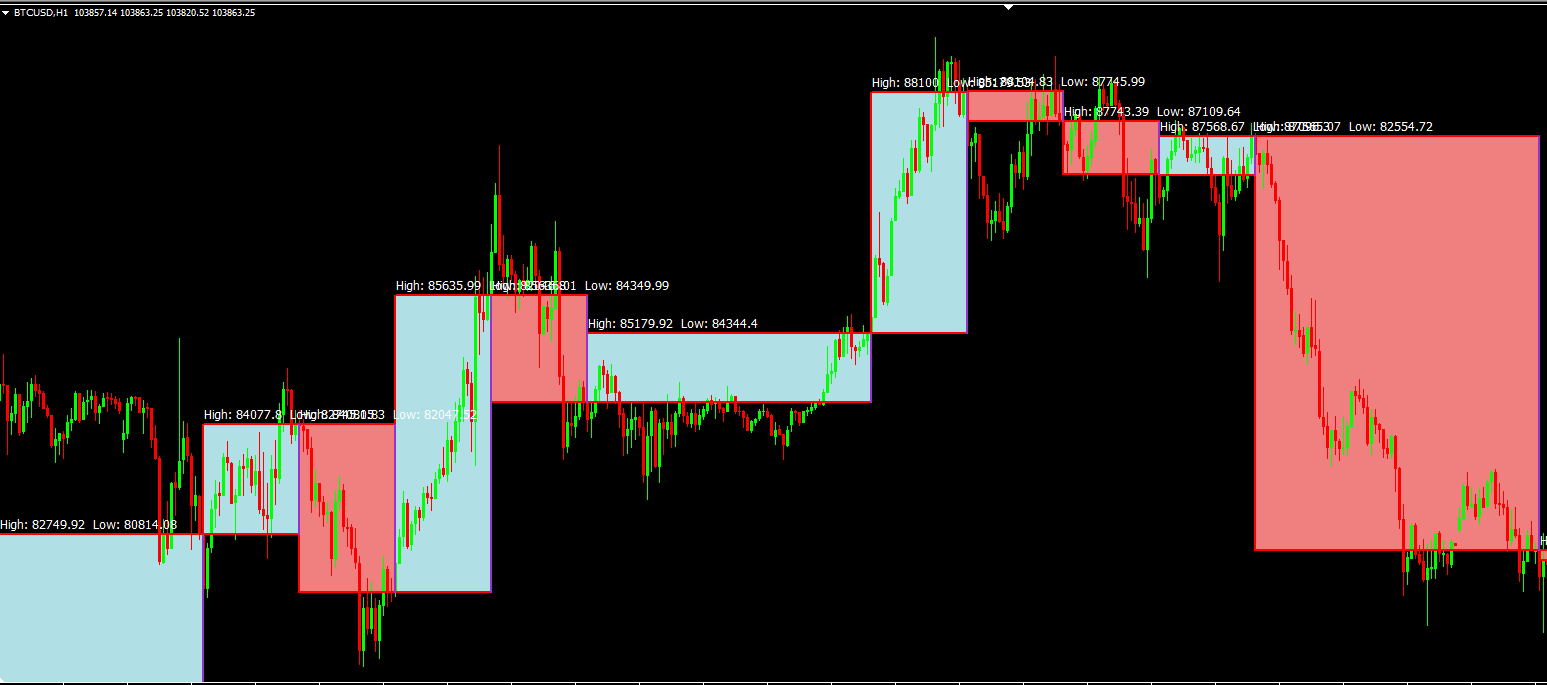
1. Price Range Boxes
Main Box (Blue/Pink): Shows daily high-low or open-close range
Period A Box (Red): Marks initial trading period (configurable hours)
Period B Box (Purple): Marks extended trading period
2. Breakout Zones
Upper Band (Light Blue): Potential breakout/resistance area
Lower Band (Light Blue): Potential breakdown/support area
3. Reference Lines
Green dashed line: Session open price
Red dash-dot line: Session close price
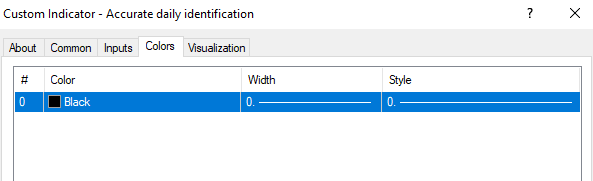
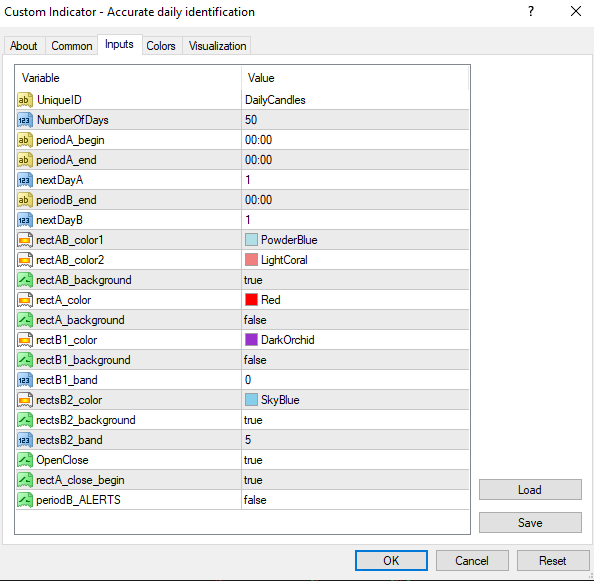
Indicator Settings
ParameterDescriptionRecommended Value
NumberOfDaysHow many days to display20-50
periodA_beginStart of Period A"00:00" (midnight)
periodA_endEnd of Period A"12:00" (noon)
periodB_endEnd of Period B"23:59" (end of day)
rectAB_color1Main box color (bullish)PowderBlue
rectAB_color2Main box color (bearish)LightCoral
rectsB2_bandBreakout band width (pips)5-10
How to Trade with This Indicator
Range Trading Strategy
Wait for price to approach either edge of the main box
Look for reversal patterns at these levels
Enter with stop just outside the box
Target the opposite side of the box
Breakout Strategy
Monitor the upper/lower breakout bands
Enter when price closes outside these bands
Use the band width as initial stop
Target previous day's high/low as first profit point
Session Trading
Note where current price is relative to Period A range
Trade breakouts from Period A range during Period B
Watch for reversals at session boundaries
Indicator Philosophy
🔹 "Master the day's rhythm - trade the ranges by day, catch the breakouts by night!"
This indicator is perfect for traders who want to:
Understand daily price structure at a glance
Trade session-based ranges
Catch breakouts with visual confirmation
Pro Tips
Combine with Volume - Only trade breakouts with increasing volume
Adjust for Your Market - Modify session times to match your traded instruments
Use Higher Timeframes - Works best on H1/D1 charts
Watch for "Inside Days" - When today's range is within yesterday's, expect breakout
🚀 Example Setup:
EURUSD H1 chart
Period A: 08:00-16:00 (London session)
Period B: 16:00-23:00 (NY overlap)
Breakout bands: 5 pips