
🧠 "Predict the Future with the Power of AI!"
— Precision Forecasting for the Modern Trader
📌 Overview
Name: AI Prediction
Version: 1.00
Platform: MetaTrader 4 (MT4)
Type: Custom Indicator
Display: Main Chart Window
Developer: R.KH 1001
Source: https://www.robomql.com
⚙️ How It Works
The AI Prediction indicator uses a mix of mathematical extrapolation and predictive modeling methods to forecast future price trends on financial charts, particularly using historical Open prices.
🔍 Prediction Methodology
You can choose between two main forecasting methods:
Method 1 – Harmonic Extrapolation
Predicts future values based on Fourier-like harmonics of past price patterns.
Uses a specific number of harmonics (HarmNo) and a frequency tolerance (FreqTOL) to match cycles.
Method 2 – Linear Prediction (LP)
Uses a model based on past prices to calculate prediction coefficients and simulate future prices.
Influenced by the LPOrder (determines model complexity) and the number of past bars.
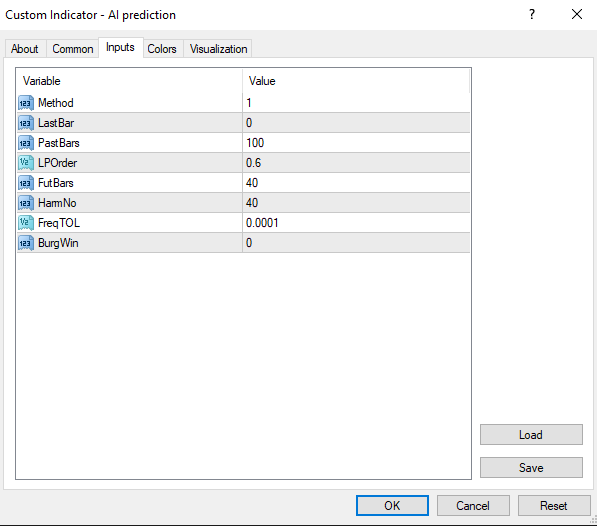
🛠️ Indicator Settings (Inputs)
ParameterDescription
MethodSelect extrapolation method: 1 = Harmonic, 2 = Linear Prediction
LastBarStarting point in the past for analysis
PastBarsNumber of bars in the past to analyze
LPOrderOrder of prediction model (0 to 1, affects coefficient count)
FutBarsNumber of future bars to forecast
HarmNoNumber of harmonics used in method 1 (set to 0 for full harmonic match)
FreqTOLTolerance level for frequency match in harmonic method
BurgWinWindow function for Burg Method (0=None, 1=Hamming, 2=Parabolic)
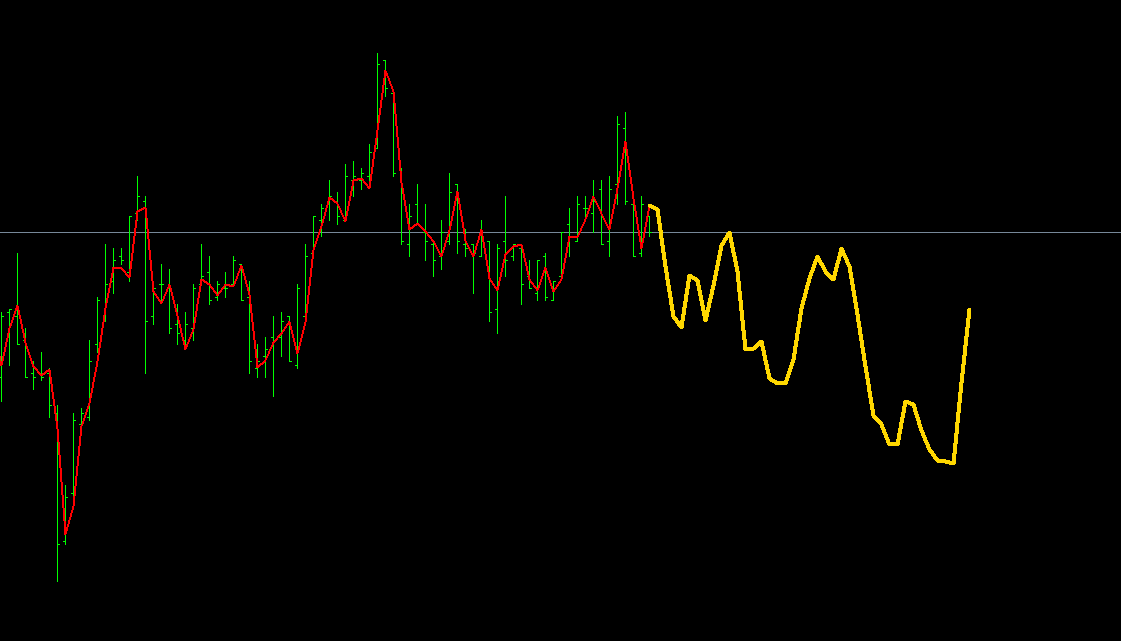
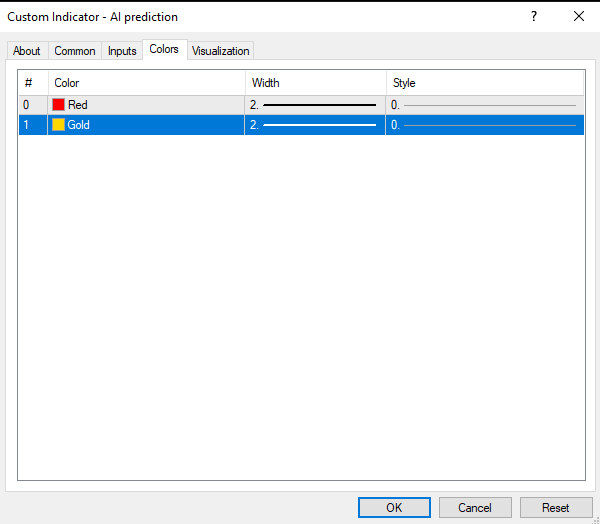
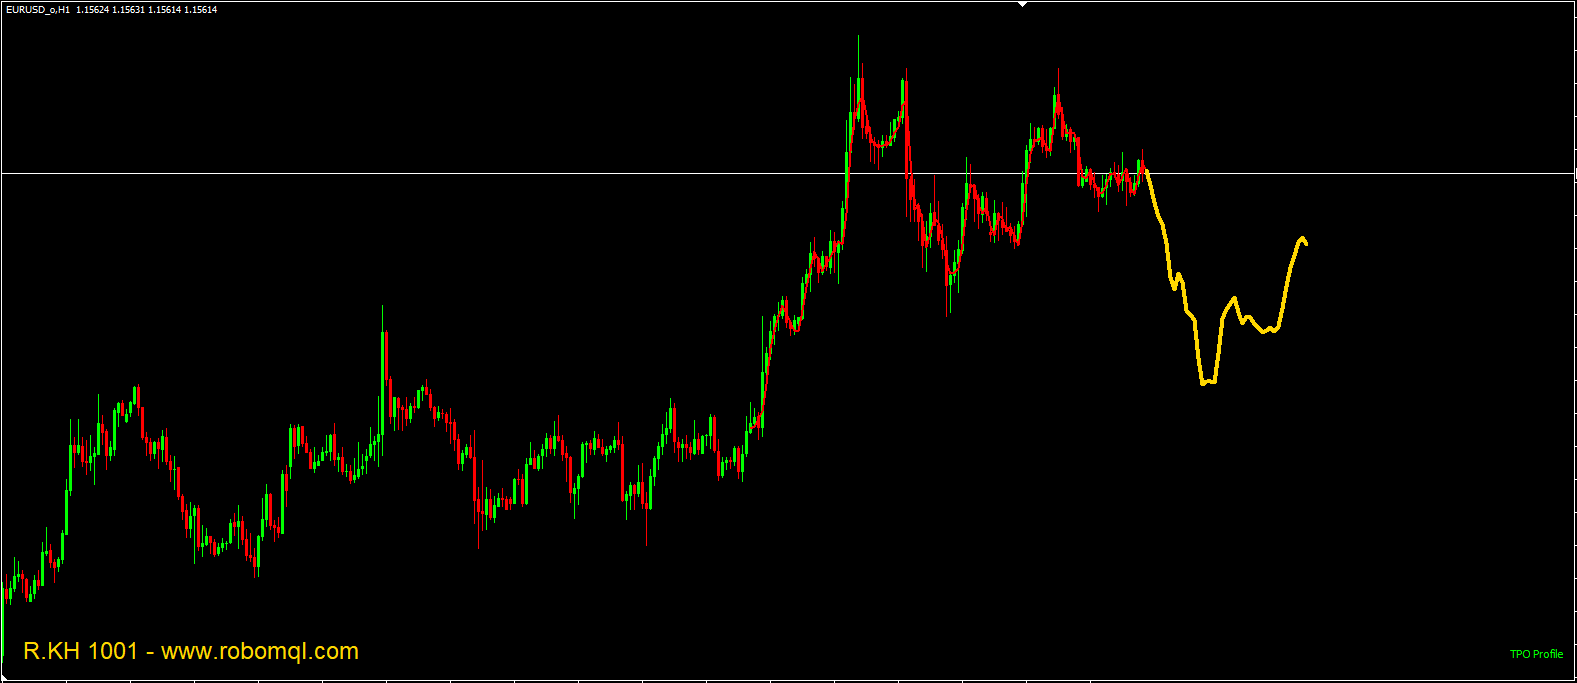
📊 Indicator Display
Red Line: Past data alignment (historical Open prices re-centered)
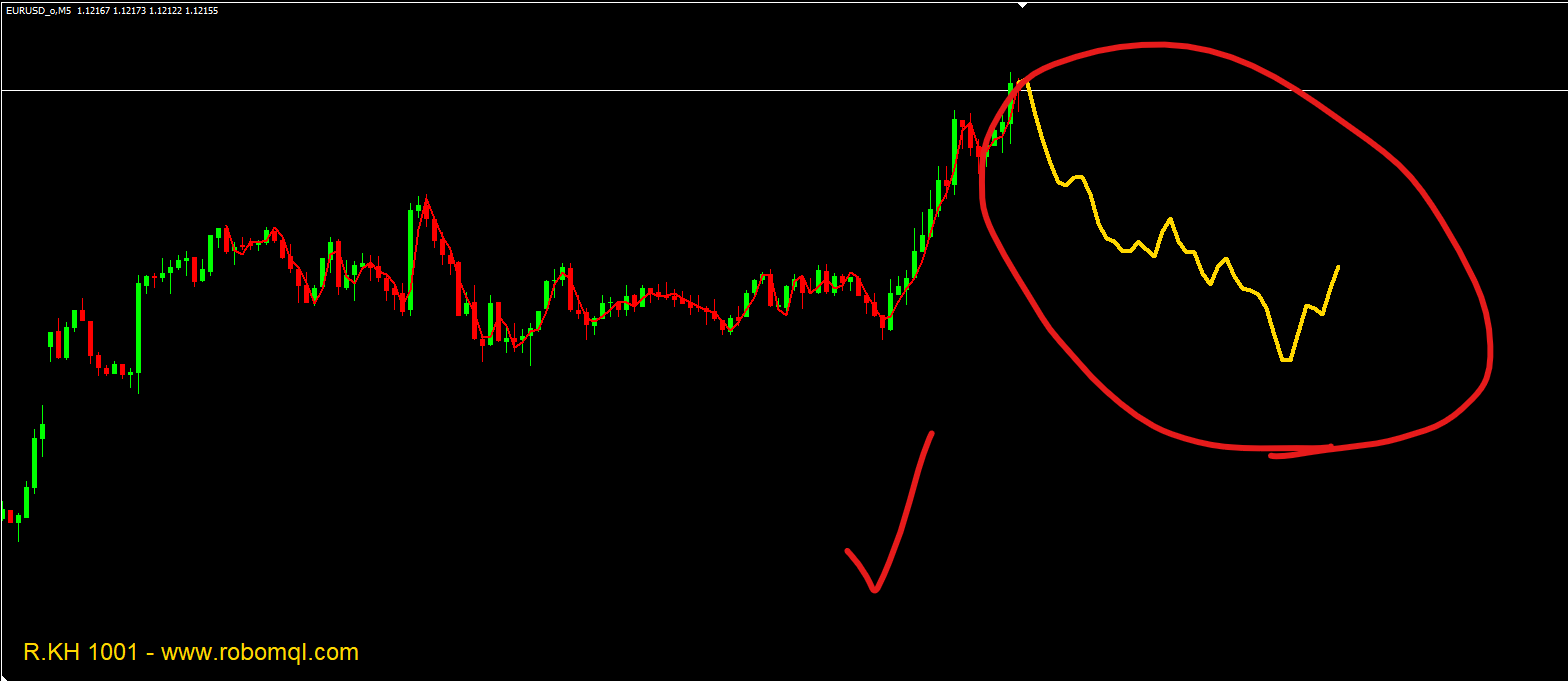
Gold Line: Predicted future values based on the selected method
These are drawn directly on the chart and visually extend from the selected historical point (LastBar) to a forecast horizon (FutBars).
🧪 Initialization Behavior
When the indicator is loaded:
Buffers are allocated for past and future values.
Chart label is created showing developer name and website.
Variables like np (past bars), nf (future bars), and no (order of prediction) are calculated.
Indicator shifts are used to place lines correctly relative to current time.
✅ How to Use
Attach to Chart: Apply the indicator on the desired asset and timeframe.
Adjust Inputs: Tune parameters like PastBars, FutBars, and Method for better fit.
Interpret Lines: Use the gold line (future forecast) to assess upcoming price behavior.
📢 Developer & Source
Developer: R.KH 1001
Source Website: https://www.robomql.com