

Algorithm Indicator - The Ultimate Multi-Timeframe Trading Dashboard
"Where Data Becomes Decisions - Trade Smarter Across All Timeframes!"
Indicator Overview
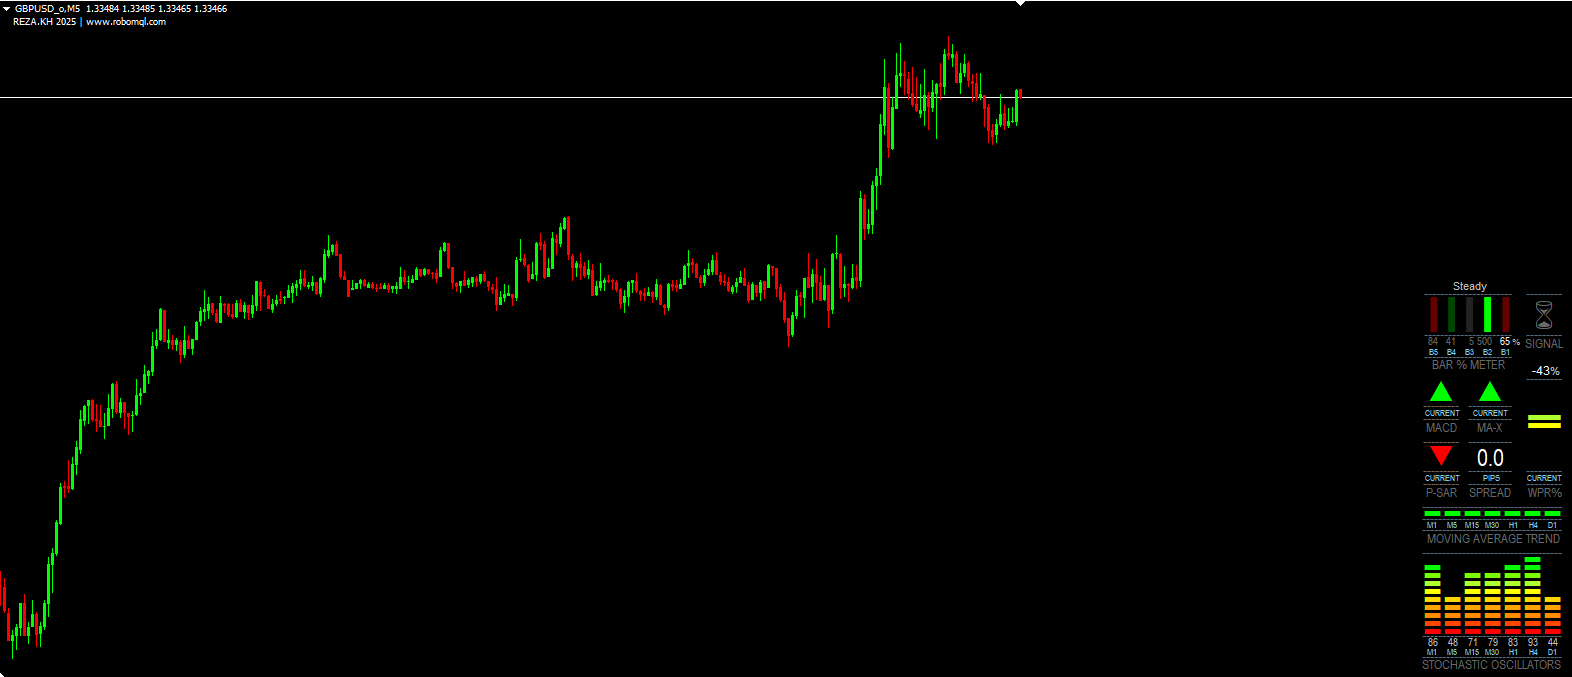
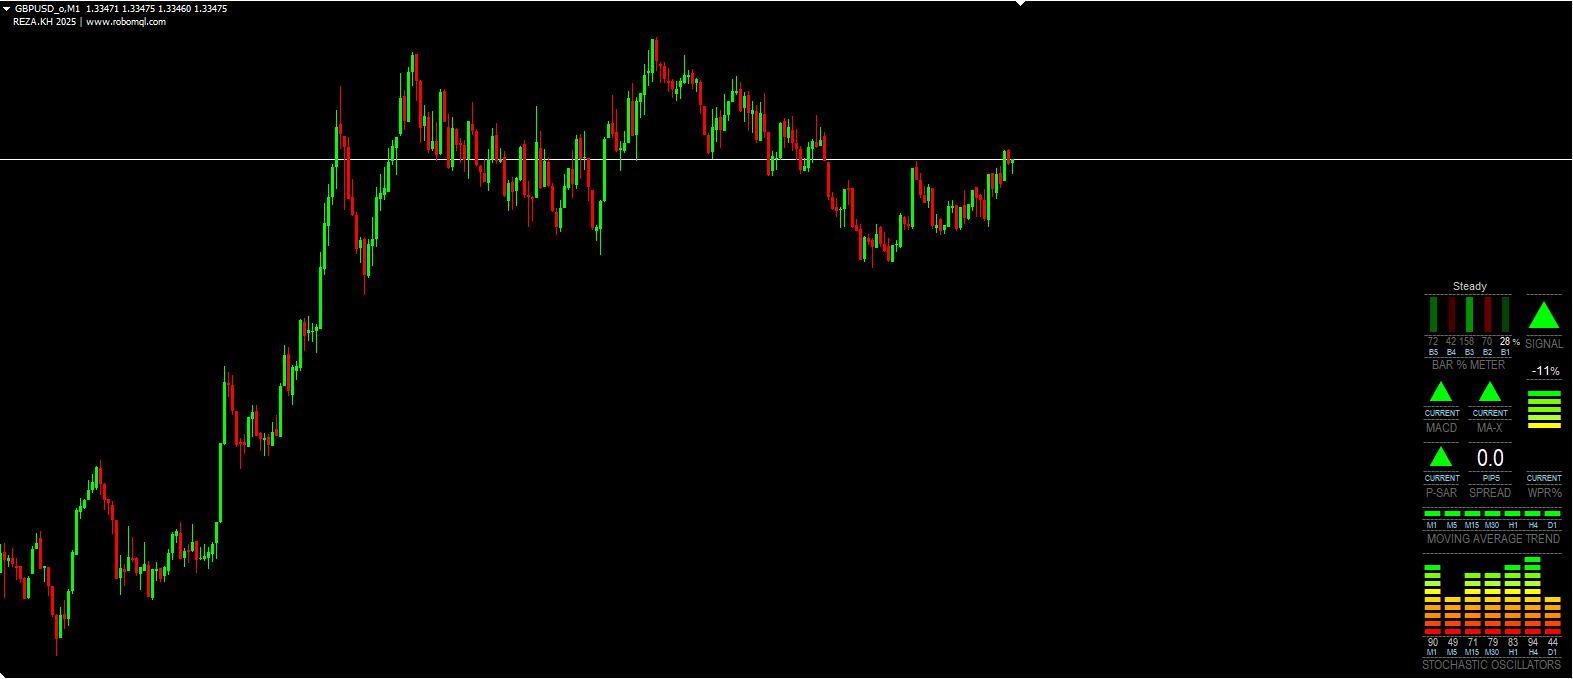
The Algorithm Indicator is a comprehensive MetaTrader 4 (MT4) dashboard that aggregates 12+ technical indicators across 7 timeframes (M1 to D1) into a single visual interface. It combines:
Trend analysis (MAs, MACD, Parabolic SAR)
Momentum oscillators (Stochastic, WPR)
Price action metrics (Bar strength, Spread)
Multi-timeframe convergence signals
Key Features
Color-coded visual alerts for entry/exit points
Real-time multi-timeframe synchronization
Customizable sensitivity for all indicators
At-a-glance market state assessment
How It Works
The indicator processes data through 4 analytical layers:
1. Trend Detection System
ComponentFunctionality
7 EMA CrossesTracks MA trends across M1/D1 timeframes
MACD HistogramIdentifies momentum shifts (12/26/9 settings)
Parabolic SARMarks potential reversals (0.02 step, 0.2 max)
2. Momentum Oscillators
Stochastic (14,3,3) - Overbought/oversold levels
Williams %R (14) - Extreme momentum detection
3. Price Action Engine
Bar Strength Meter - Compares current bar to 5-bar average
Spread Monitor - Ticks in real-time
4. Signal Generation
Triggers when:
MACD + MA + Stochastic align in one direction
WPR confirms extreme momentum
Bar momentum accelerates
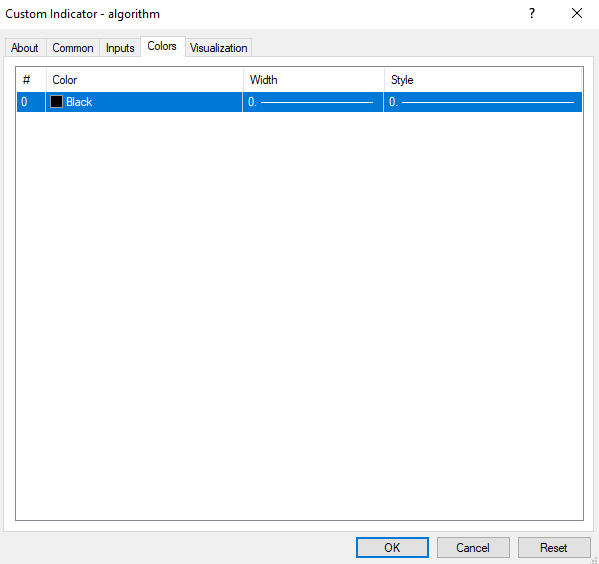
Indicator Settings & Parameters
Core Inputs
ParameterDescriptionDefault
Stoch_KStochastic %K period14
Stoch_DStochastic %D smoothing3
MA_PeriodEMA length for trend14
FastLWMAFast MA for crossovers3
SlowSMASlow MA for crossovers5
PSAR_StepSAR sensitivity0.02
Recommended Adjustments
Scalping: Reduce MA_Period to 8-10
Swing Trading: Increase Stoch_Slowing to 5
Volatile Pairs: Raise PSAR_Max to 0.3
How to Use in Trading
Entry Signals
BUY When:
Green "p" arrow appears
M1/D1 MAs turn bullish (Lime)
MACD crosses above signal line
SELL When:
Red "q" arrow appears
WPR -80
Bar Strength shows deceleration
Risk Management
Stop Loss: 1.5x ATR(20) from entry
Take Profit: At next fractal level
Best Practices
Confirm signals with higher timeframe trends
Avoid trading during spread 3 pips
Combine with volume spikes for confirmation
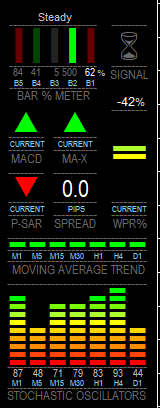
Dashboard Sections
1. Stochastic Matrix (Top)
Color gradients (Red to Lime) show overbought/oversold
Values for M1, M5, M15, M30, H1, H4, D1
2. MA Trend Panel
Binary indicators (Red/Lime) for each timeframe
3. MACD/PSAR/WPR Modules
Visual arrows for crossovers
Real-time WPR percentage
4. Bar Momentum Meter
Histogram shows relative strength:
Dark Green: Strong bullish momentum
Dark Red: Strong bearish momentum
Conclusion
The Algorithm Indicator transforms complex multi-timeframe analysis into actionable visual signals. Whether you're a scalper, day trader, or swing trader, this dashboard provides the clarity needed to trade across all market conditions.
Trade With Precision, Win With Confidence! 🚀
"In the Chaos of Markets, Algorithms Bring Order."
Note: For optimal performance:
Test settings on a demo account
Adjust FastLWMA/SlowSMA ratios to match your trading style
Monitor the Signal section for high-probability entries