
AO Divergence Indicator
Forex BUY SELL signals from the best MT4. AO Divergence indicator. Divergences detector. Accurate trend indicator.
CATEGORIES: TREND, MT4, SIGNAL, OSCILLATOR
Updated on: 17.11.2023
The AO Divergence indicator or the Awesome Oscillator Divergence indicator is an upgraded version of the traditional Awesome Oscillator.
The AO Divergence indicator is calculated by subtracting the two Simple Moving Averages (SMA). The convergence and divergence of the fast SMA and slow SMA help us to define the direction and strength of the movement, as well as discover reversal points on the chart.
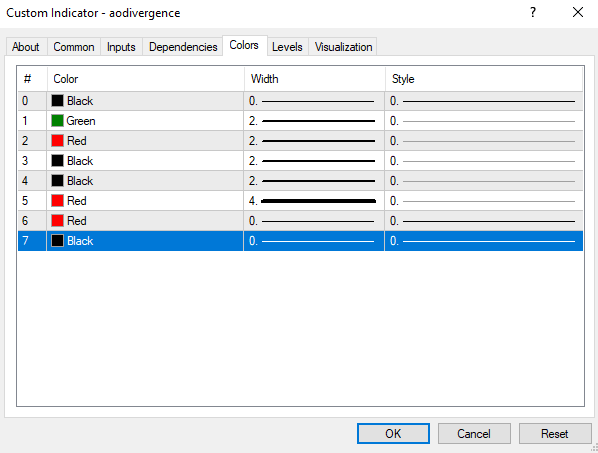
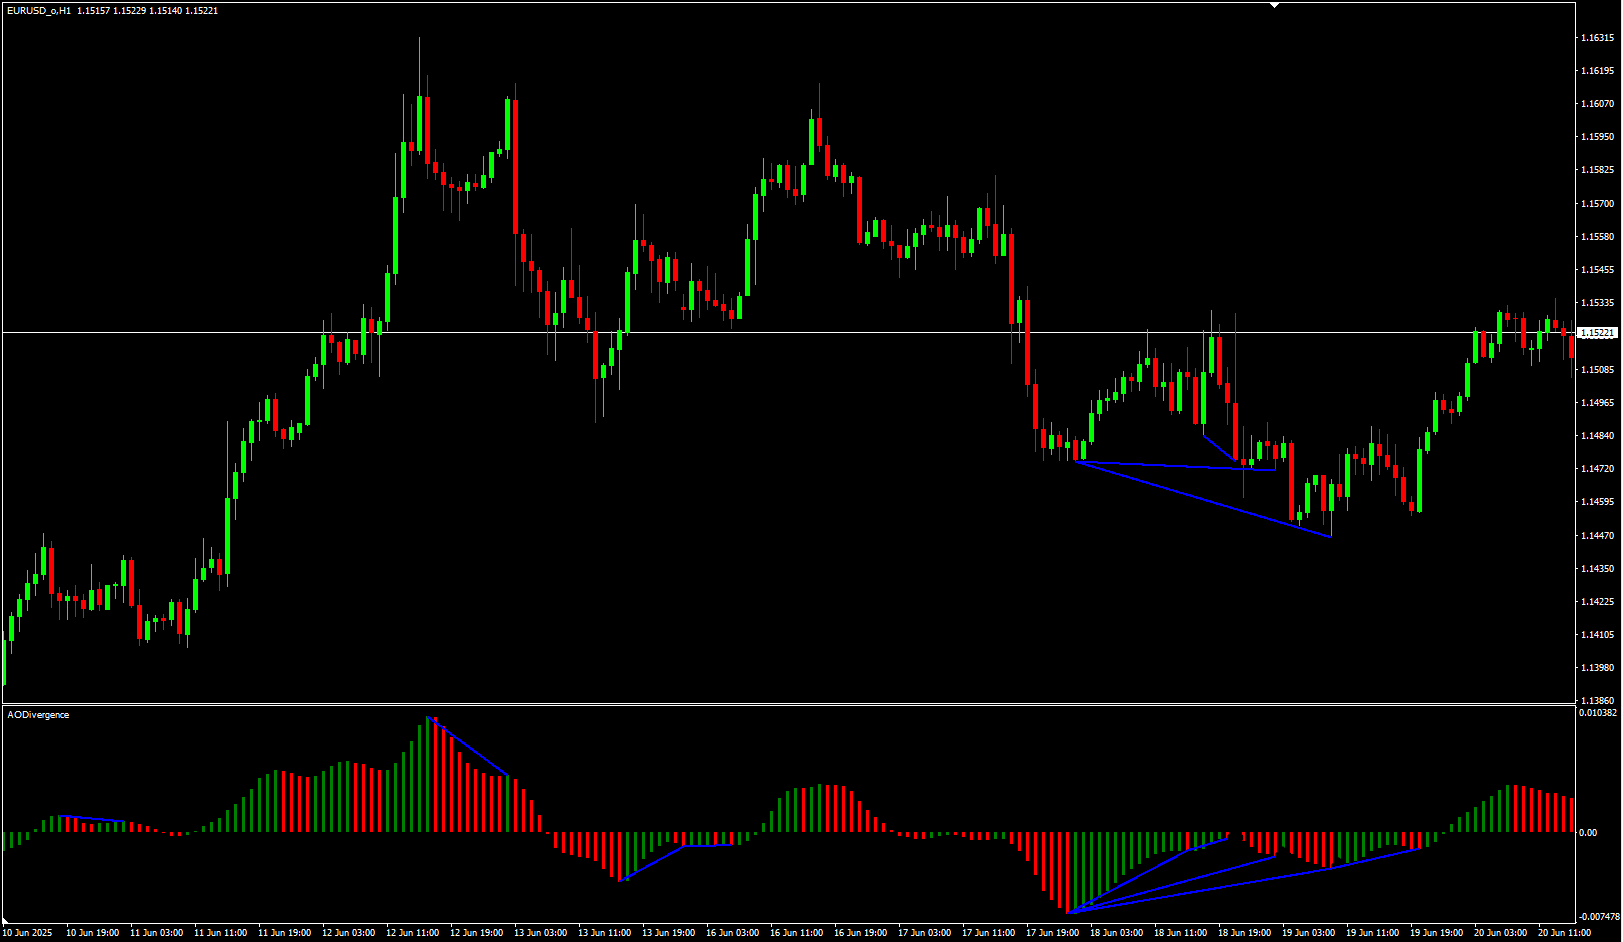
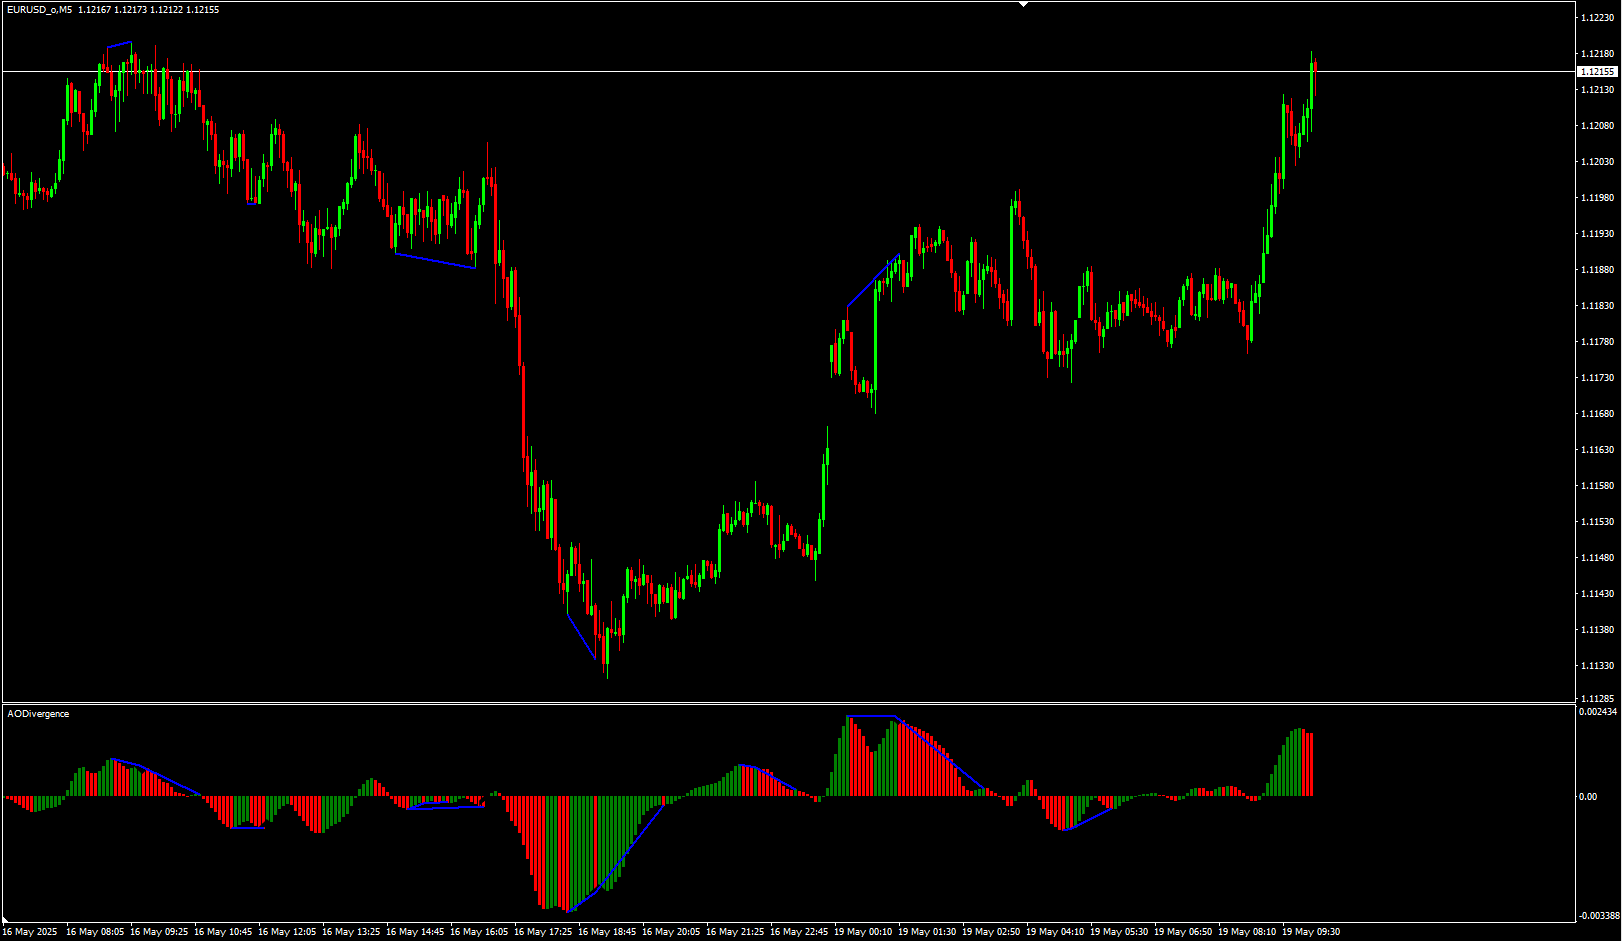
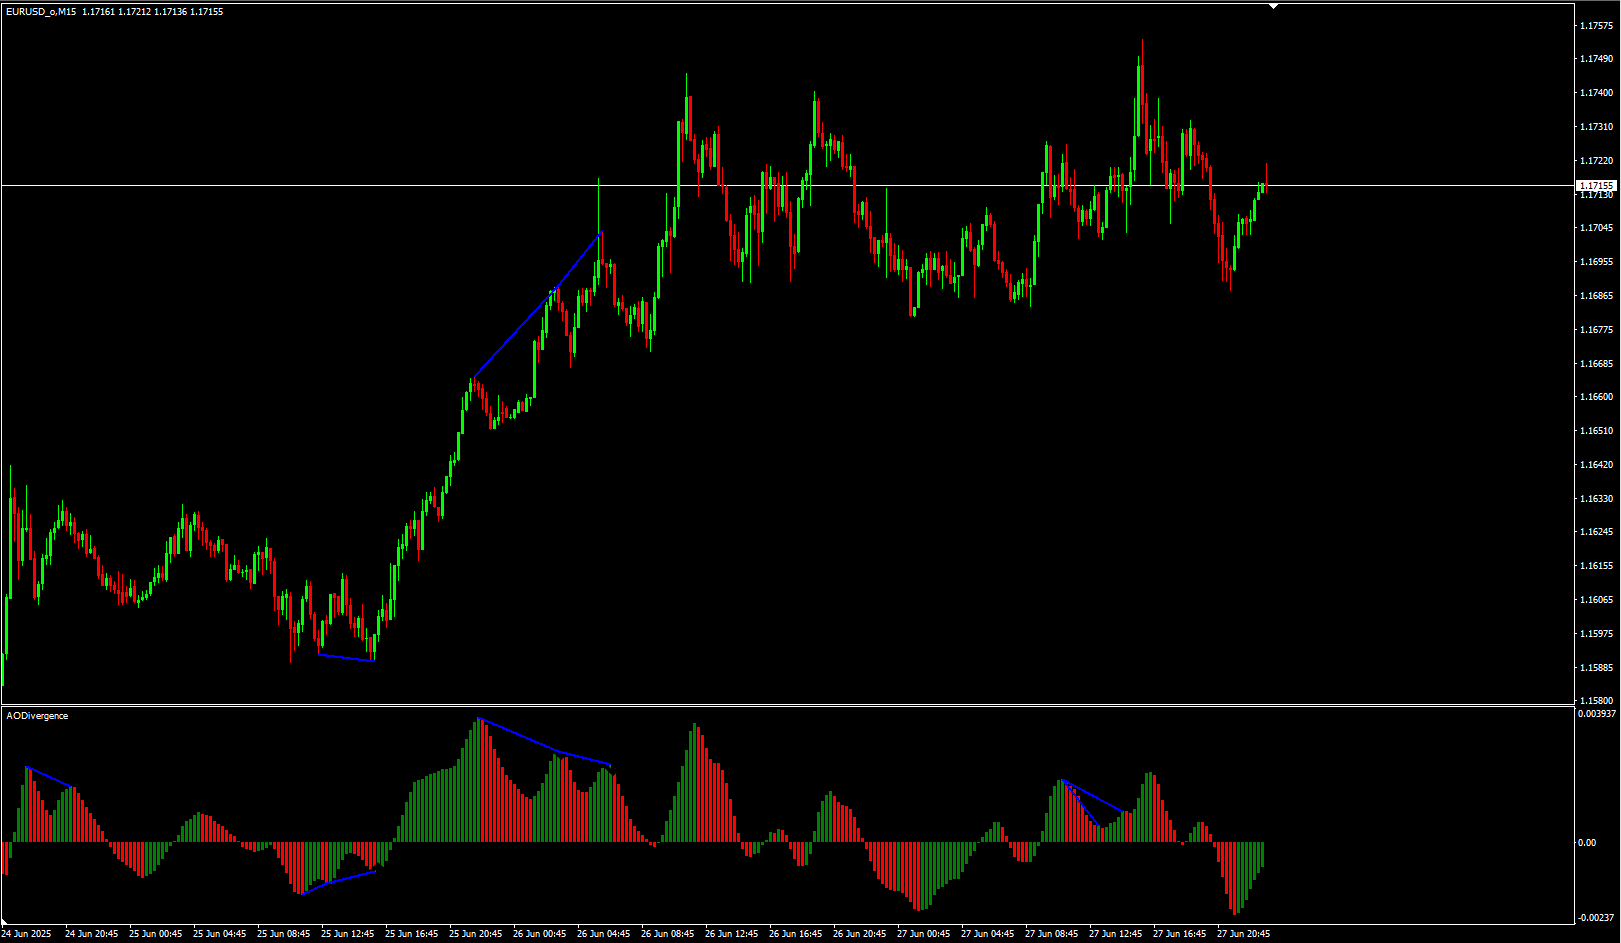
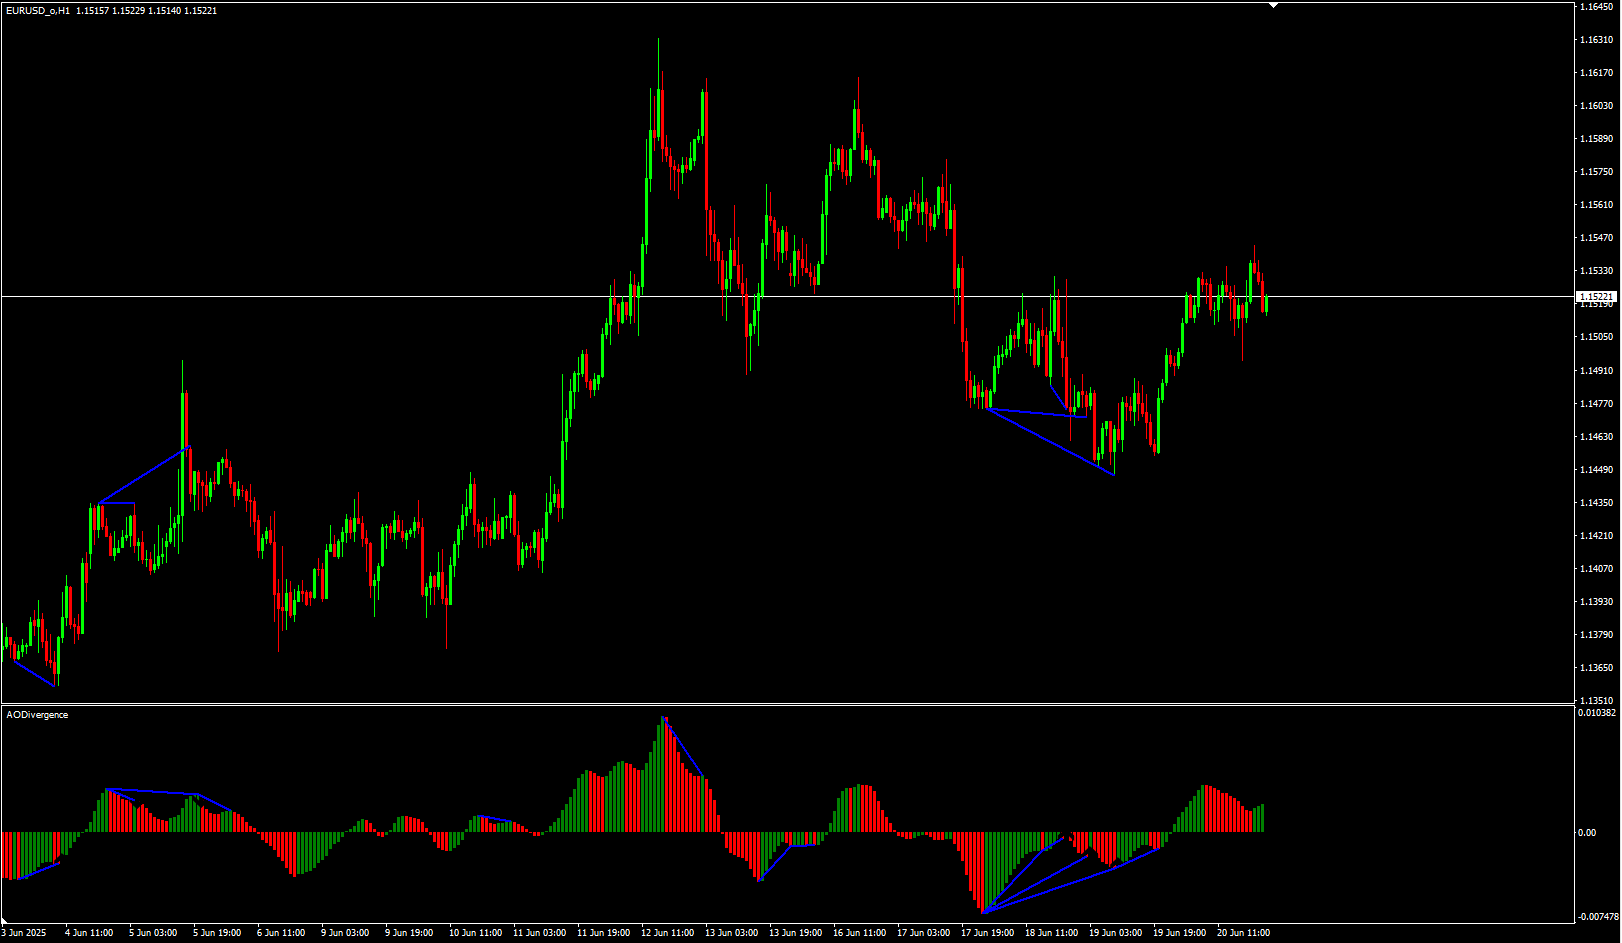
This indicator appears as a colored bar histogram in a separate window beneath the price chart. The green bars represent an uptrend while the red bars mark the downtrend.
The indicator also paints blue lines divergences on the chart. The divergences mark the ending and beginning of a trend. The arrows of the indicator pinpoint give us BUY and SELL signals.
AO Divergence Indicator BUY/SELL signals
The above GBP/USD chart H4 shows the BUY and SELL signals for the indicator.
Whenever the AO Divergence indicator plots a bullish divergence and there’s a downward arrow, it’s a sell signal. On the other hand, the indicator paints an upward arrow and the bearish divergence for the buy signal.
In the bullish momentum, this indicator’s histogram is greater than zero and starts an upswing. After another high, the bars begin to fall and become red. A green bar occurs if the histogram does not go below 0 and reverses upwards.
Conversely, in the bearish momentum, the indicator’s histogram falls below zero and starts to decline. Following another low, the bars begin to increase and turn green. A red bar occurs if the histogram does not rise above 0 and reverses downward.
The zero line also illustrates the BUY and SELL signals. If the histogram passes level 0 from below, it indicates a buy signal. In contrast, if the histogram crosses level 0 from above, it indicates that it is time to sell.
How the AO Divergence indicator is useful?
The indicator presents multiple BUY and SELL signals through divergences, histogram, and the zero line. Hence, it gives you exact entry and exit points.