
AutoTrendChannel PRO Indicator - Detailed Explanation
Overview
Key Features
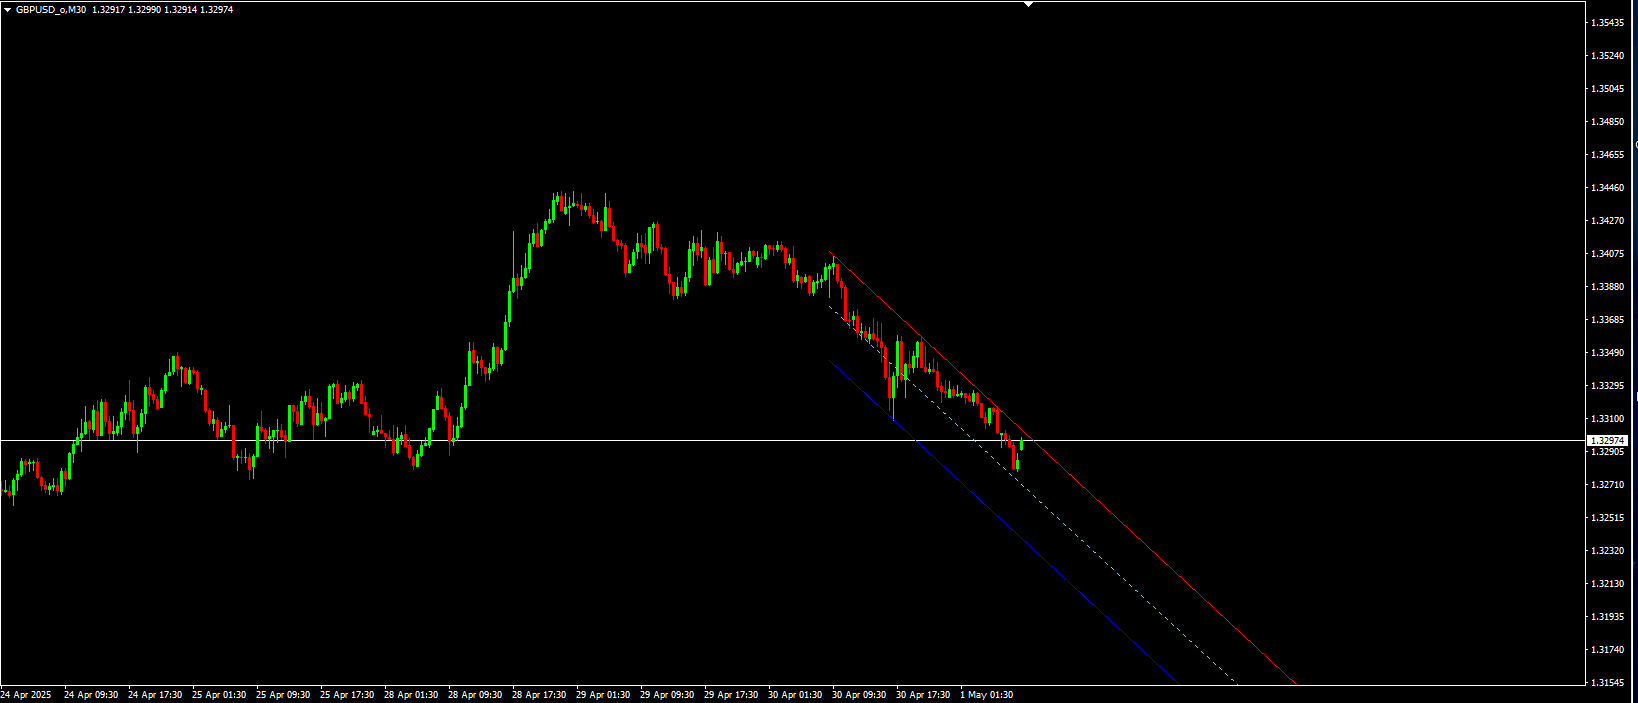
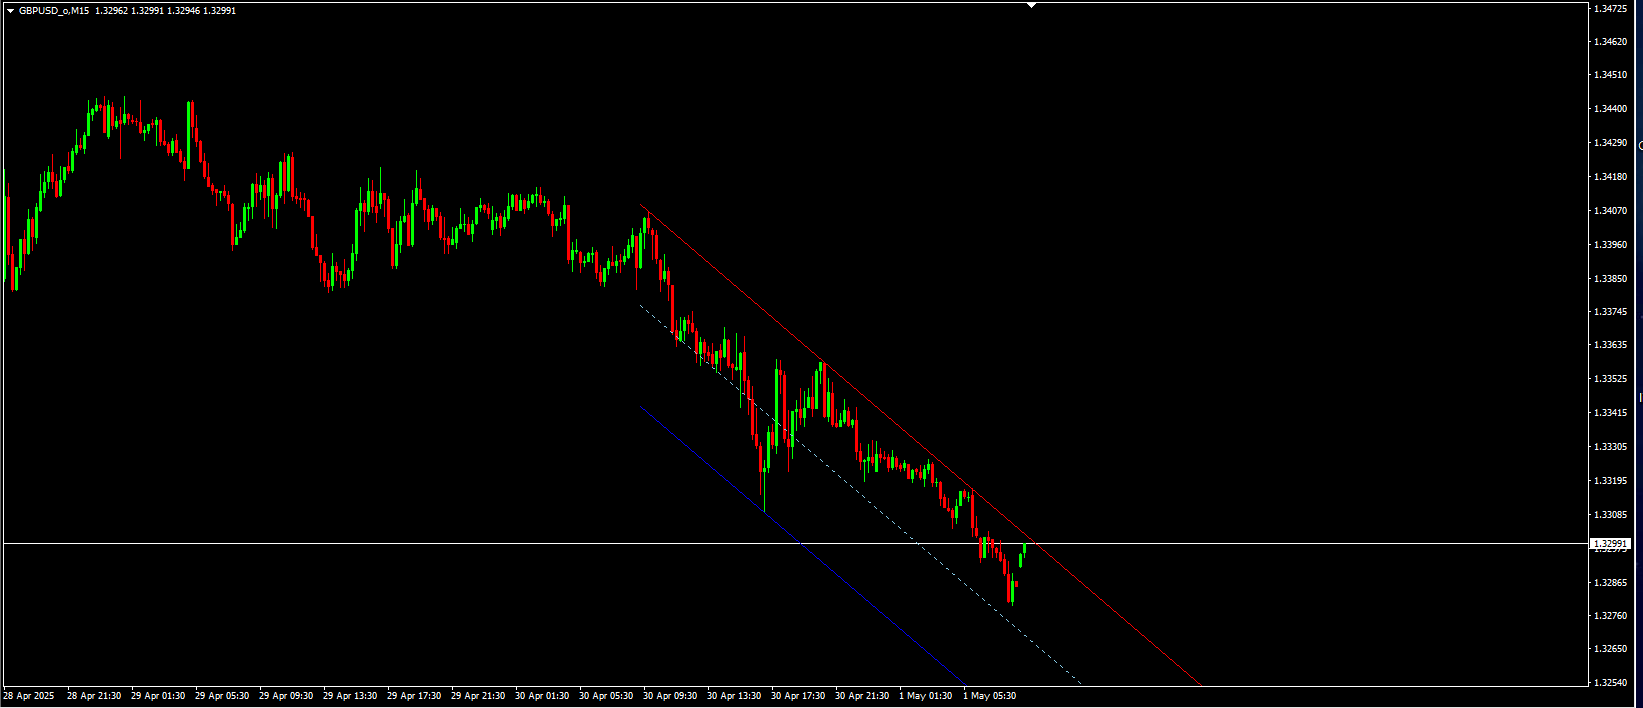
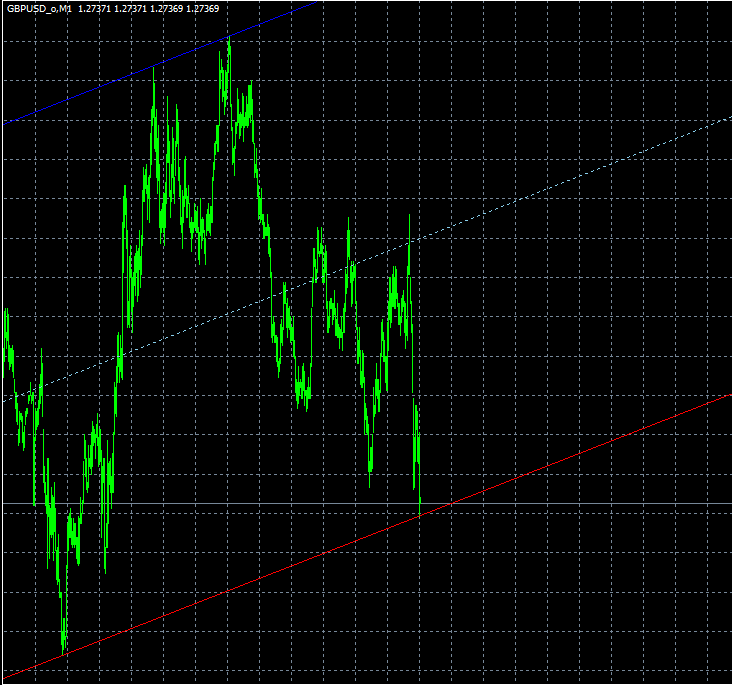
Visual Components:
Three parallel trend lines drawn in different colors:
Upper line (Bearish): Red (default) - acts as resistance
Middle line: SkyBlue (default) - acts as central equilibrium
Lower line (Bullish): Blue (default) - acts as support
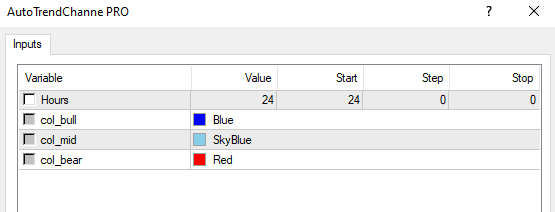
Customizable Parameters:
Hours: Sets the lookback period in hours (default 24)
col_bull: Color for bullish lower line
col_mid: Color for middle line
col_bear: Color for bearish upper line
How It Works
1. Linear Regression Calculation
The indicator first calculates a linear regression line using the closing prices over the specified period (Hours parameter). This forms the mathematical foundation for the channel.
2. Peak and Trough Identification
The algorithm then:
Identifies the highest highs and lowest lows relative to the regression line
Divides the analysis period into two halves to find significant extremes
Compares the strength of highs vs. lows to determine the dominant trend direction
3. Channel Construction
Depending on whether highs or lows are more significant (f=1 or f=2), the indicator:
For f=1 (highs dominant):
Draws the upper line connecting the most significant highs
Calculates the lower line based on the deepest pullback from the upper line
Places the middle line equidistant between them
For f=2 (lows dominant):
Draws the lower line connecting the most significant lows
Calculates the upper line based on the highest rally from the lower line
Places the middle line equidistant between them
4. Dynamic Adjustment
The indicator includes an iterative process (up to 20 refinement passes) to:
Continuously improve the fit of the channel lines
Adjust for new price extremes
Ensure the channel best represents the current price action
Trading Applications
Trend Identification:
Price above middle line suggests bullish bias
Price below middle line suggests bearish bias
Support/Resistance Levels:
Upper line acts as potential resistance
Lower line acts as potential support
Middle line acts as dynamic equilibrium
Breakout Trading:
Break above upper channel may indicate strong bullish momentum
Break below lower channel may indicate strong bearish momentum
Mean Reversion:
Prices approaching upper channel may suggest overbought conditions
Prices approaching lower channel may suggest oversold conditions
Technical Notes
The indicator uses time-based calculation (Hours parameter) rather than fixed bar count
It automatically redraws when new candles form
The algorithm gives more weight to recent price action by analyzing two distinct periods (first and second halves of the lookback window)
The middle line is always drawn as a dotted line for visual distinction
Color Scheme
The default color scheme uses:
Blue for bullish elements (lower line)
SkyBlue for the middle line (neutral)
Red for bearish elements (upper line)