
Average Range Indicator - Comprehensive Guide
🏆 Motto:
"Trade with Precision – Let the Average Range Illuminate Your Path to Profitable Decisions!"
📌 Overview
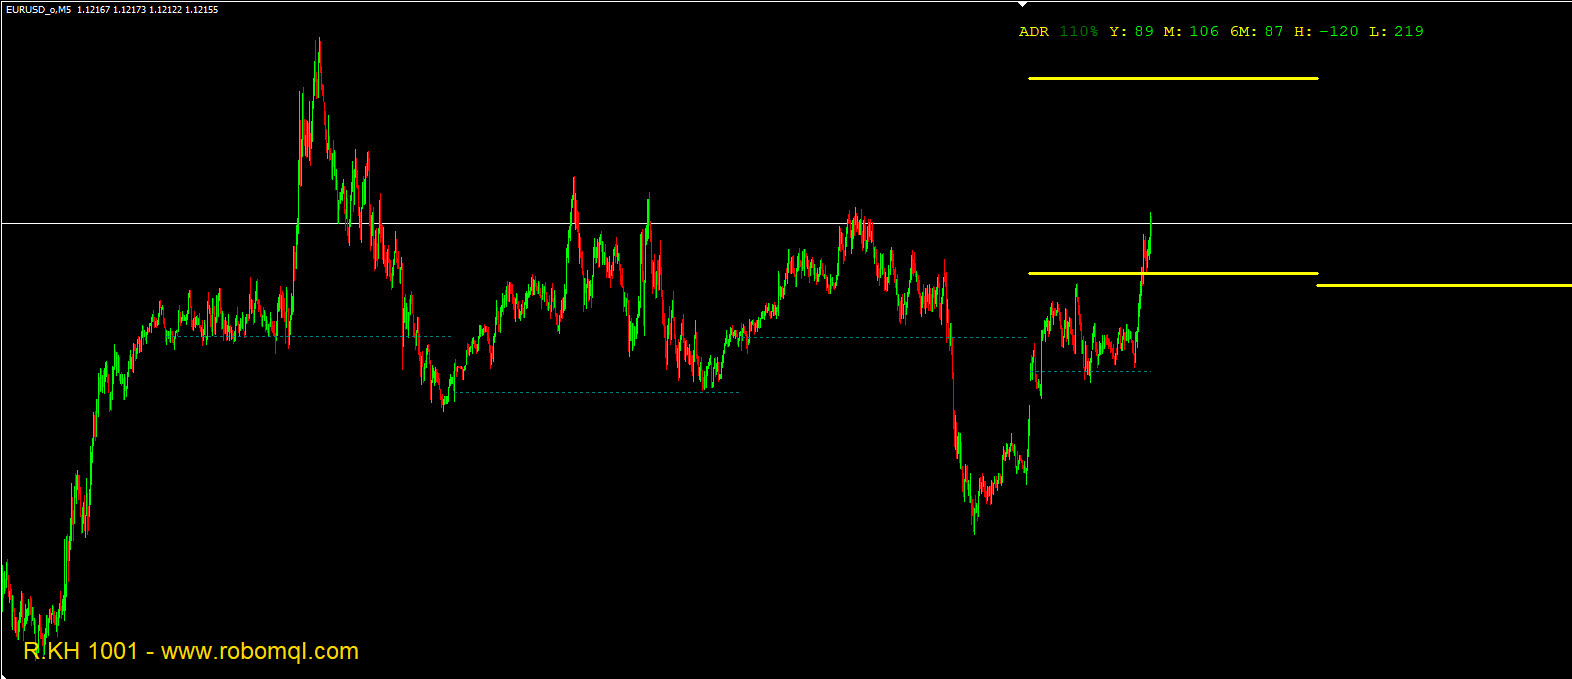
The Average Range (ADR) Indicator is a powerful MetaTrader 4 (MT4) tool developed by R.KH 1001 that helps traders analyze price volatility across multiple timeframes. This indicator calculates and displays key metrics including:
Daily/Weekly/Monthly Average True Ranges
Current Day's High/Low
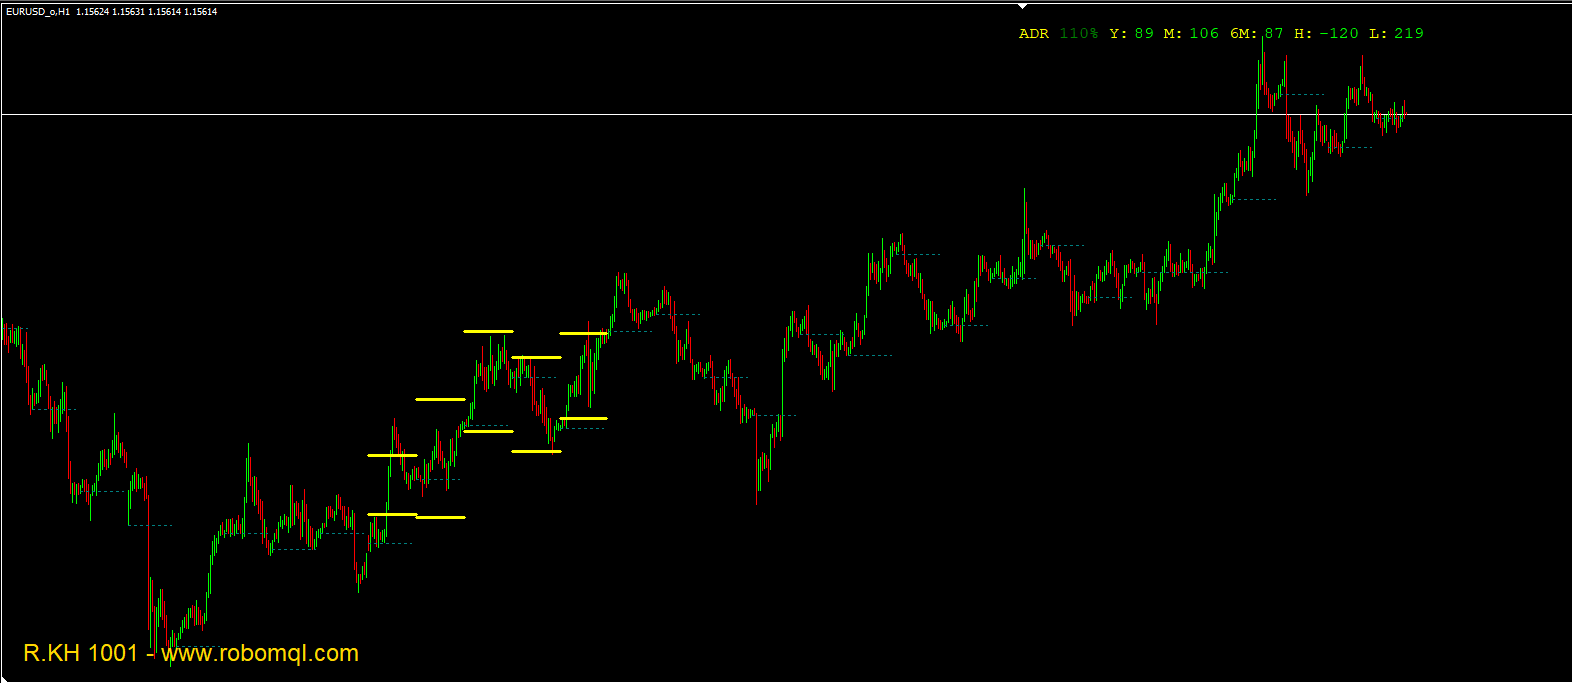
ADR Percentage (showing how much of the average range has been covered)
Historical High/Low Lines
Available on RoboMQL, it's ideal for breakout traders, swing traders, and volatility-based strategies.
🔧 How It Works
The indicator:
Calculates Average Daily Range (ADR) – Based on historical price movement
Plots Key Levels – Shows where price is relative to its typical range
Visualizes Volatility – Color-codes ADR percentage (green=above average, red=below)
Multi-Timeframe Analysis – Displays YTD, 6-month, and monthly averages
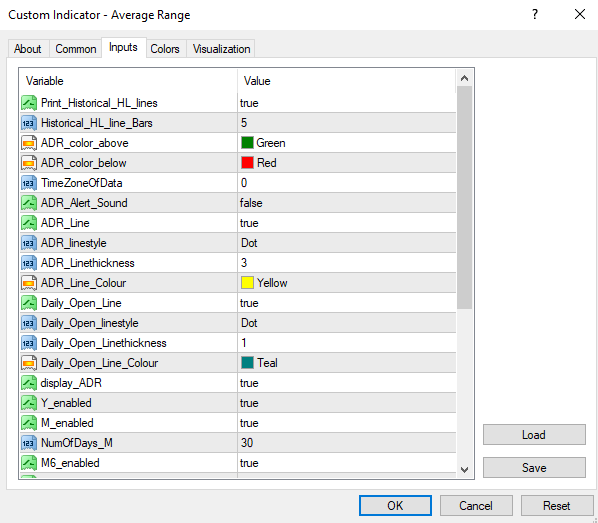
⚙️ Indicator Settings
Core Parameters
ParameterDescriptionDefault
Print_Historical_HL_linesShows previous days' high/low linestrue
Historical_HL_line_BarsNumber of historical bars to display5
ADR_Alert_SoundAlerts when ADR exceeds 100%false
TimeZoneOfDataAdjusts for broker timezone differences0
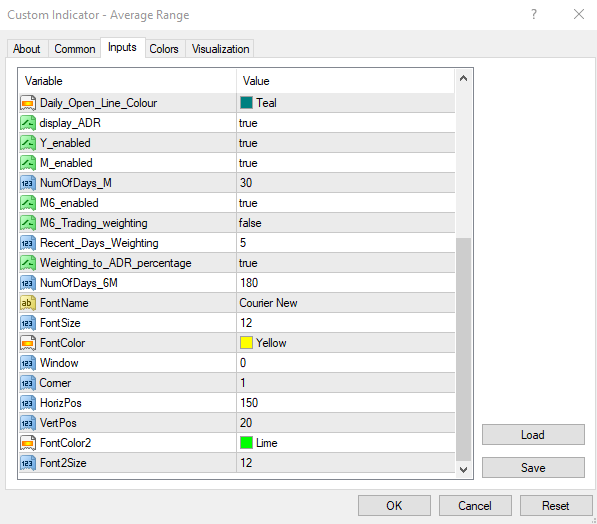
Visual Customization
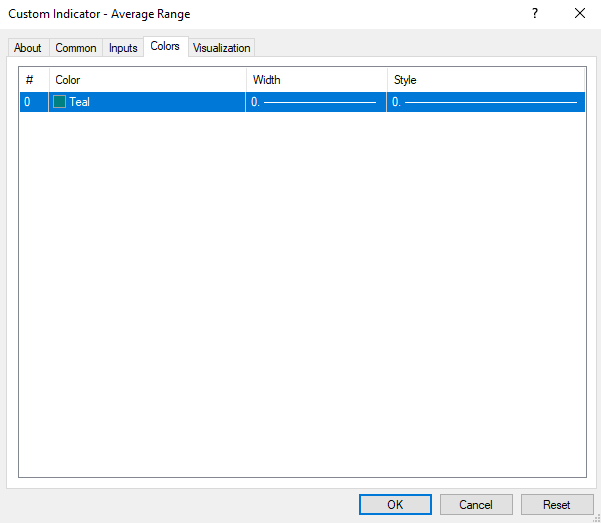
Line Colors: Configure ADR lines, daily open, and high/low markers
Line Styles: Dotted/dashed/solid options for each element
Text Display: Font size, color, and positioning controls
Timeframe Options
Enable/disable Year-to-Date (Y), 6-Month (6M), and Monthly (M) calculations
Adjust lookback periods (NumOfDays_D, NumOfDays_M, etc.)
📊 Key Features
1. ADR Calculation
Shows how much of the average range has been covered (as percentage)
Color-coded alerts for high/low volatility conditions
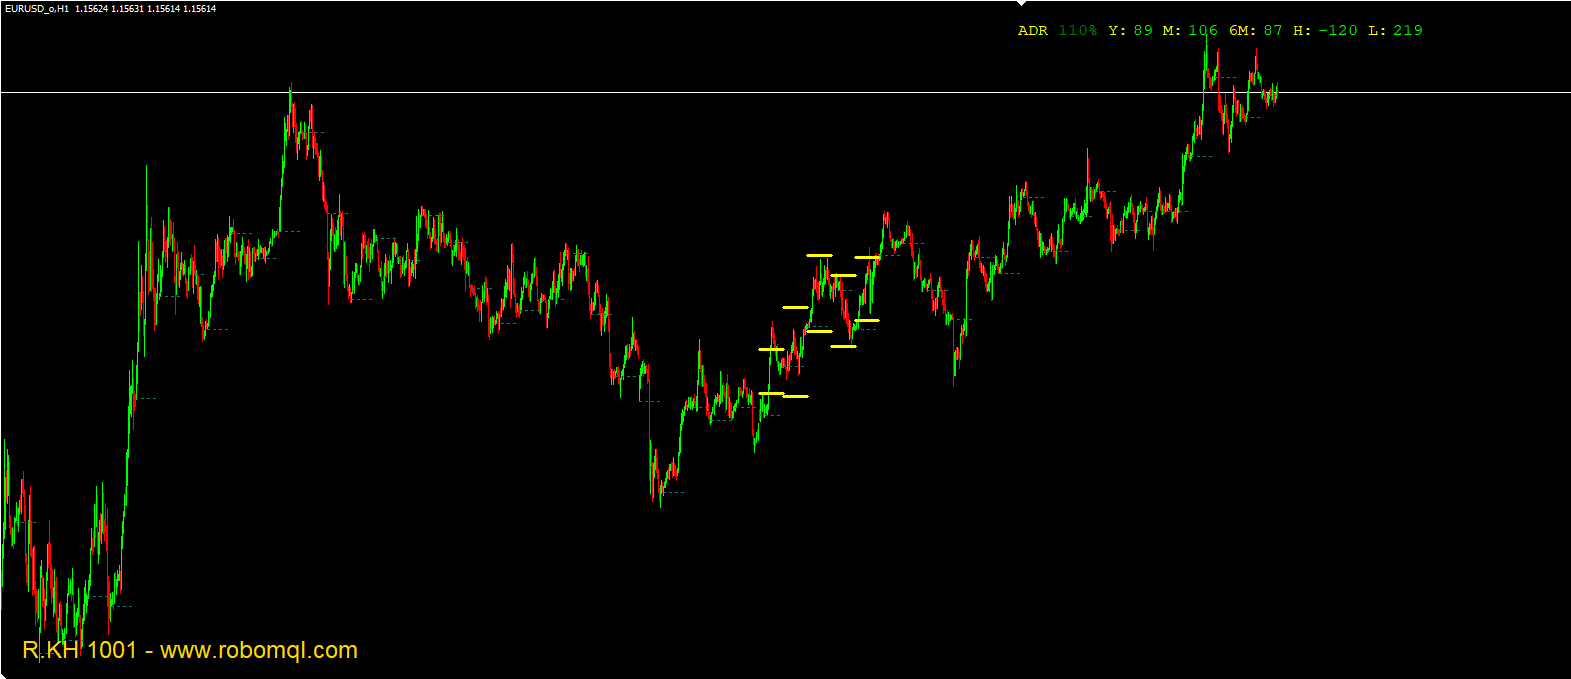
2. Historical High/Low Lines
Projects previous days' ranges onto current chart
Helps identify potential support/resistance zones
3. Multi-Timeframe Volatility Analysis
Compare current volatility against:
1-month average
6-month average
Year-to-date average
4. Smart Weighting System
Optional recent day weighting for more responsive calculations
Configurable ADR percentage or pips display
📈 Practical Applications
For Breakout Traders
Enter when price approaches historical ADR high/low
Stay out when 50% of ADR is covered (low volatility)
For Range Traders
Fade moves near ADR extremes
Use daily open line as mean-reversion point
Risk Management
Adjust position sizing based on current volatility
Set stops beyond key ADR levels
⚡ Pro Tips
Combine with volume indicators to confirm breakouts
Watch for ADR 100% days – often signal trend acceleration
Use monthly ADR in earnings season for stocks/indices
👨💻 Developer & Source
Developer: R.KH 1001
Website: RoboMQL
🌟 Why Traders Love It
"The ADR Indicator transformed my trading – I now enter only when volatility aligns with my strategy, avoiding false breakouts during low-ADR periods." – *Forex Trader, 5+ Years Experience*
Trade Smarter with Data-Driven Volatility Insights! 📊