

Candlestick Dashboard Indicator - all candlestick patterns on one ch
Many of you know what role in technical analysis are candlestick patterns. This is the subject of a whole trading system based on candlestick patterns - Price Action. But to look for these figures on the chart is a very tedious and time-consuming process. So I'm offering you an Indicator that will do it for you. Candlestick Dashboard Indicator displays over 30 candlestick patterns (including reversal, continuation, trend exhaustion patterns - and single, double, and triple candlestick patterns; and others) in all major currency pairs (can be selected in the settings) and on all time frames. Moreover, the indicator will indicate by the arrow the expected price movement, if you are at a loss to remember.
Characteristics of Candlestick Dashboard
Platform: Metatrader4
Currency pairs: All currency pairs, indices, stocks, futures, and gold
Trading Time: Around the clock
Time Frame: Any
Recommended broker: InstaForex, XM, RoboForex
How it works?
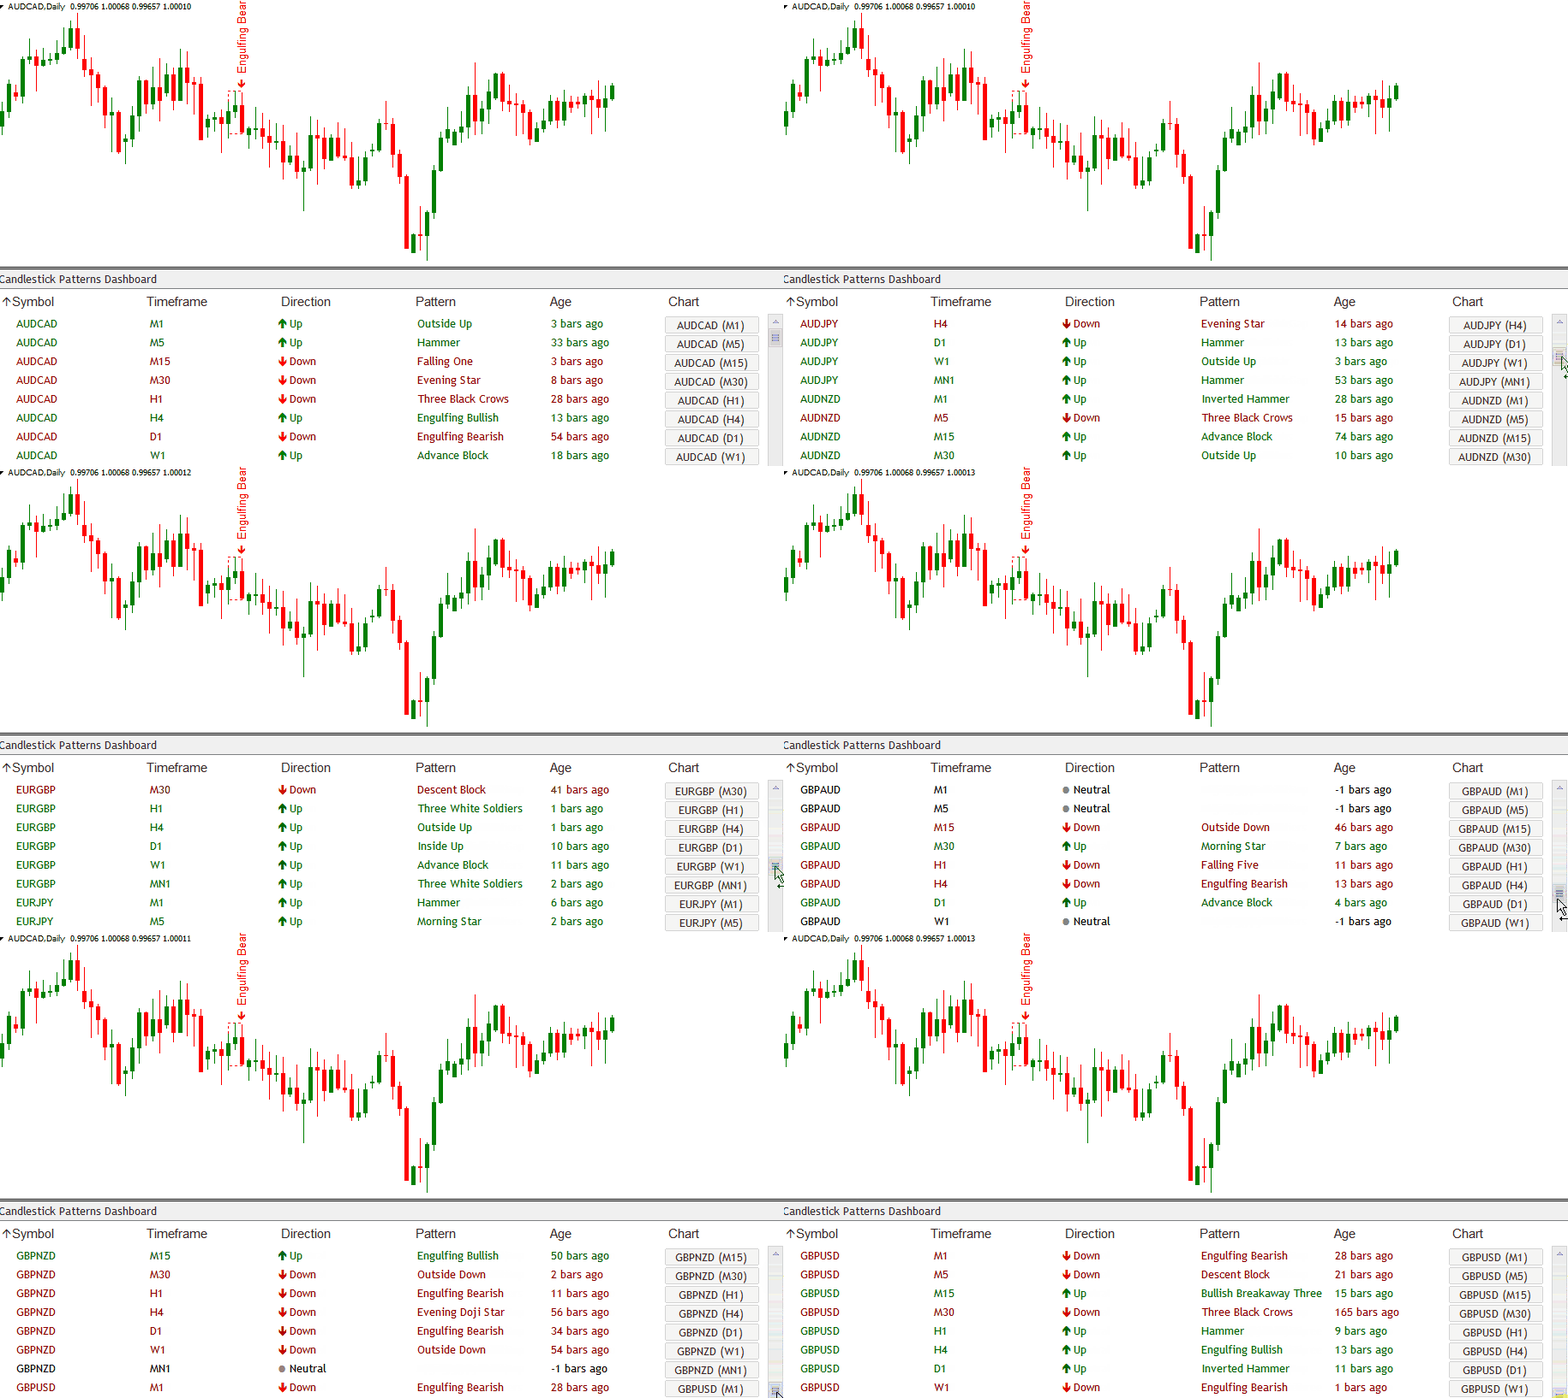
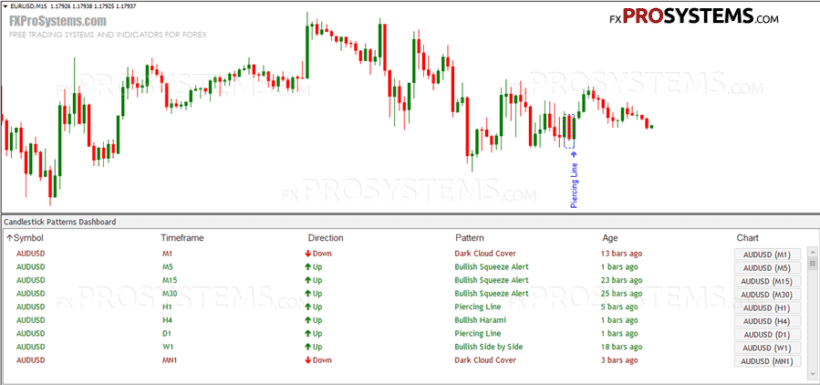
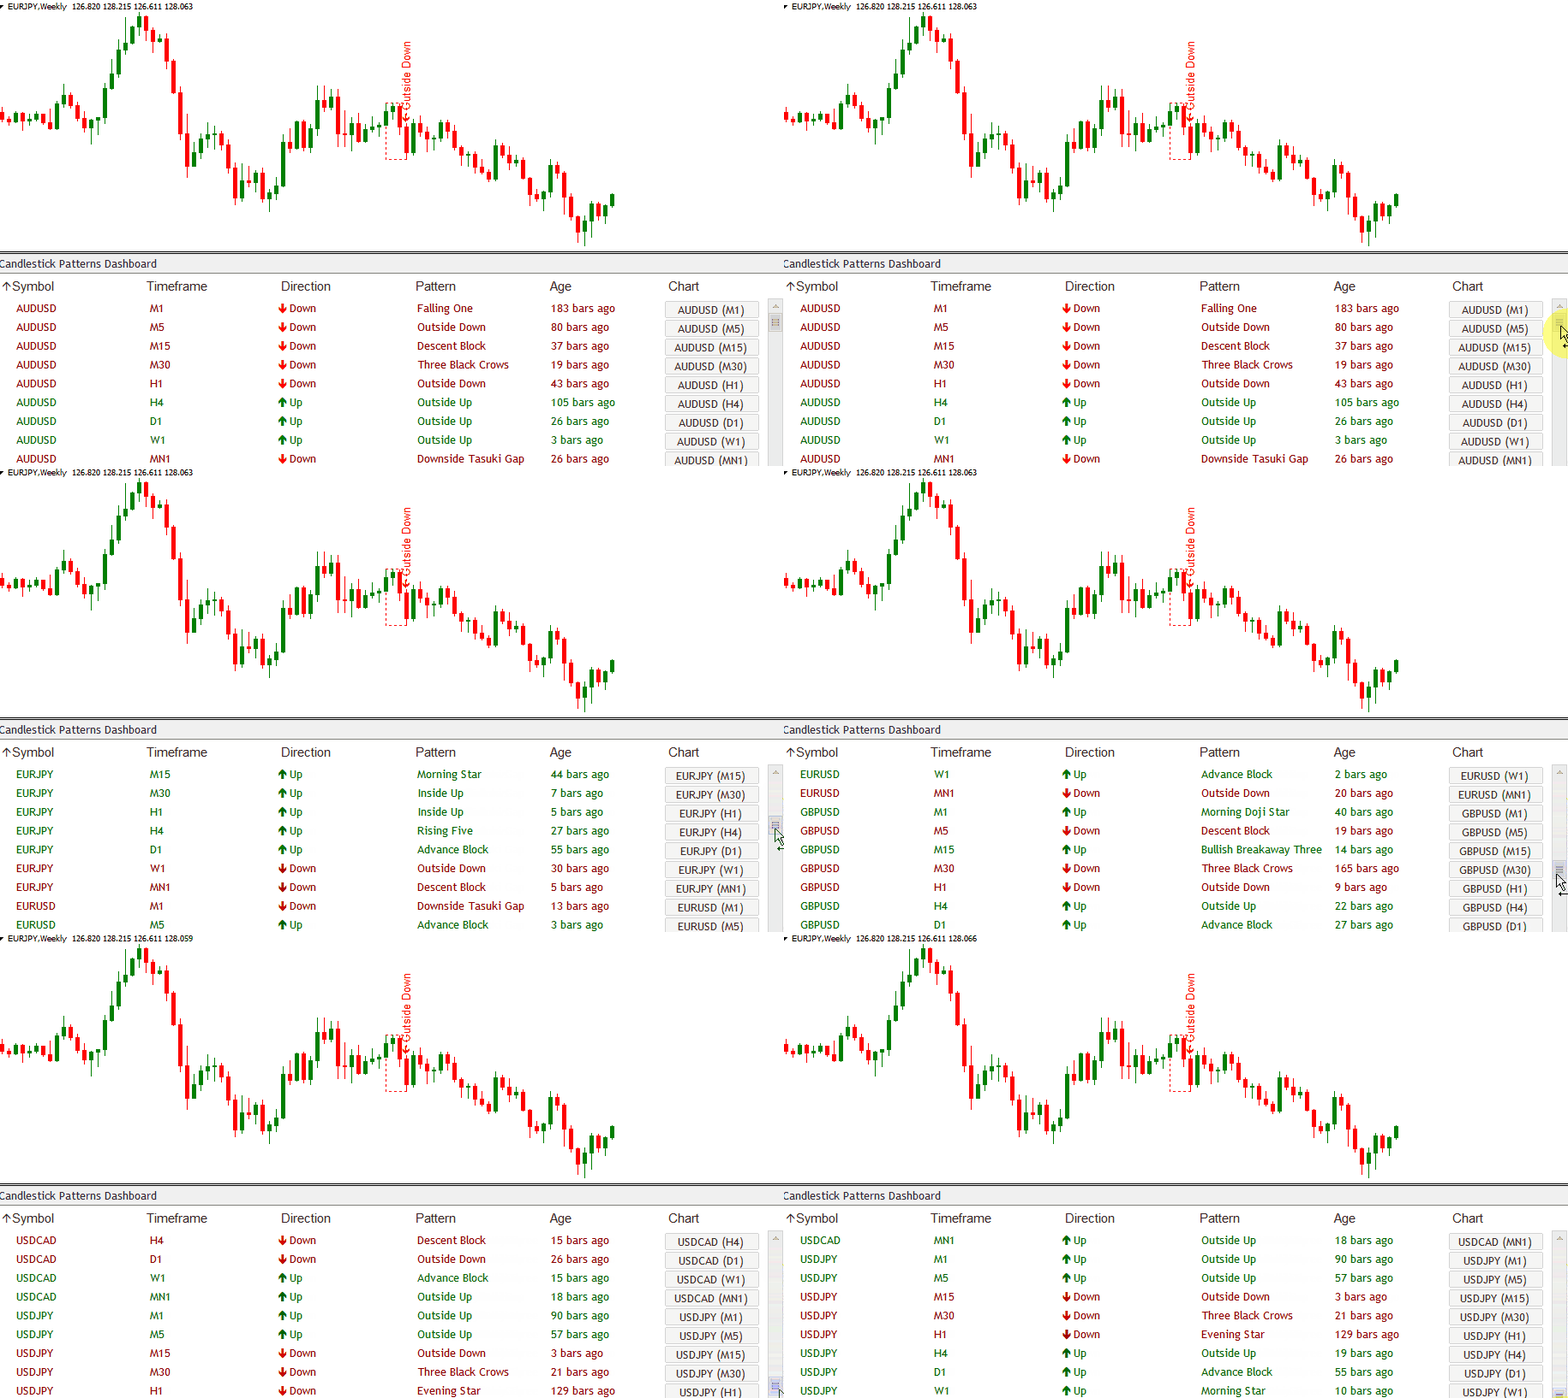
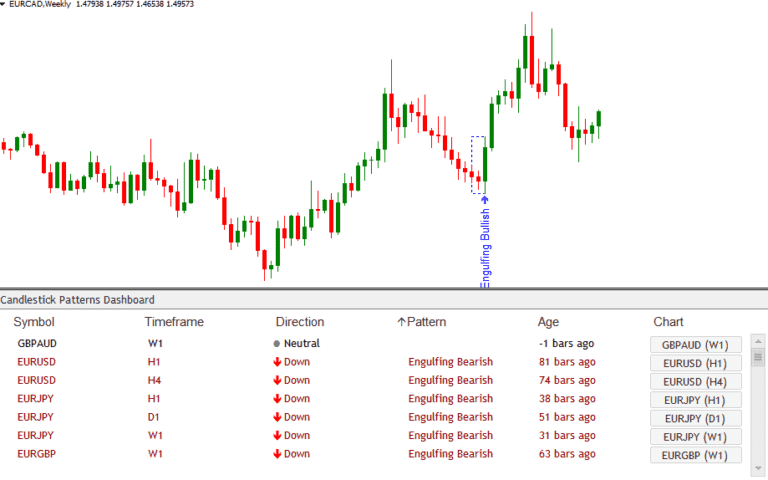
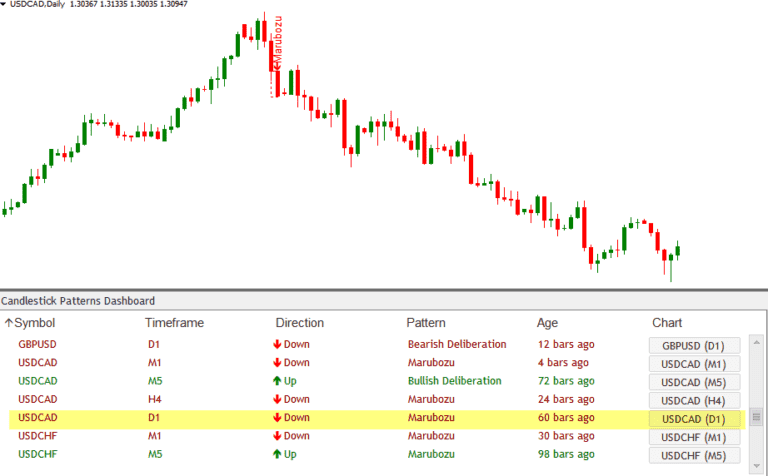
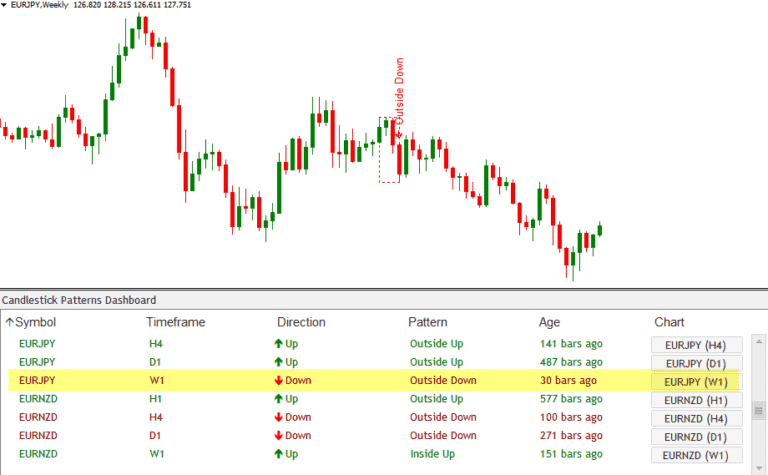
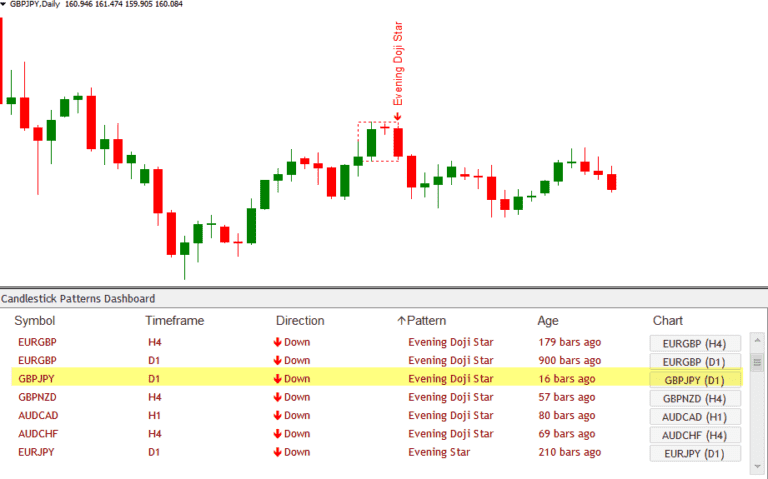
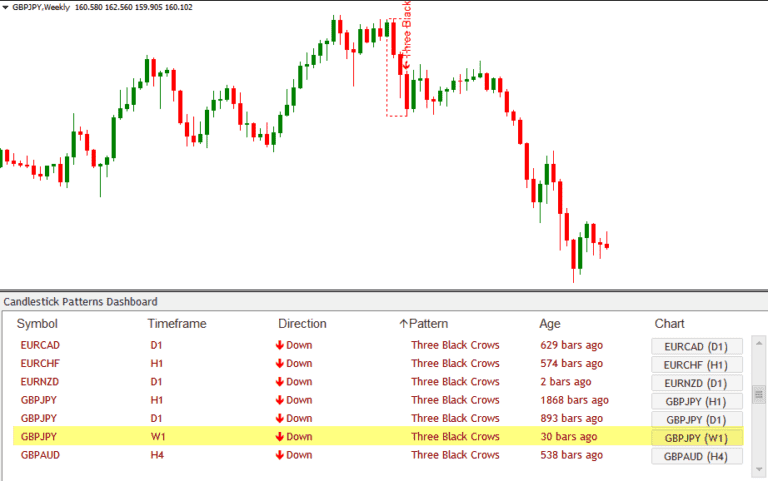
Candlestick Dashboard spends just a few seconds to find candle patterns and displays them all in the table below the chart. You do not need to run around a lot of chart s, you can scan simply by switching to the desired pair and the time frame in the table:
candlestick-dashboard-demonstration
With just one look at the dashboard, you'll instantly know all the information you need to make a good trading decision. You'll instantly know which candlestick pattern appears on every time-frame (from 1-minute to monthly) and on every currency pair. Not only that, you'll also know the exact direction of that pattern - whether it's bullish or bearish. And you'll know exactly how long ago that particular pattern showed up.