
×
![]()
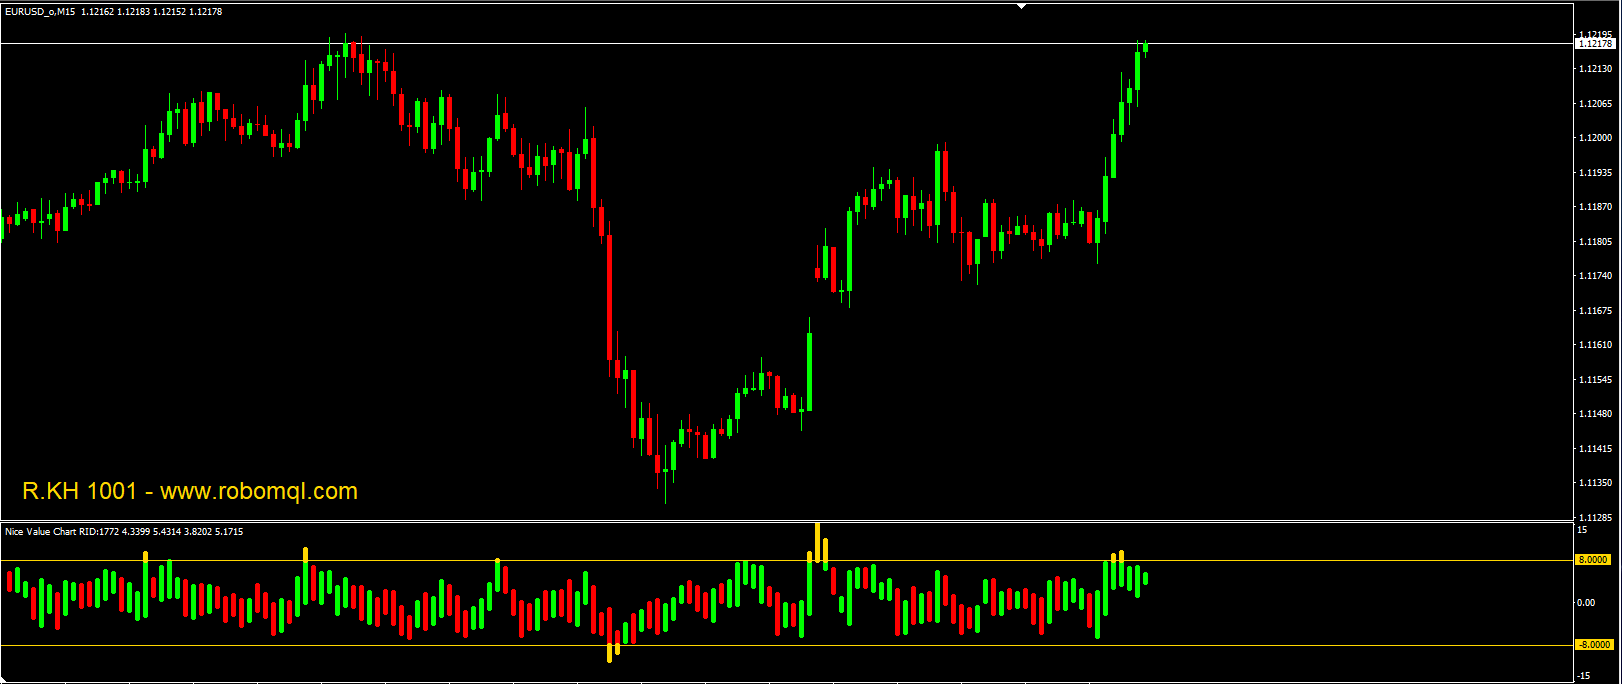
Nice Value Chart Indicator
"Trade with Precision – Let the Market Reveal Its True Value!"
🔹 Overview
The Nice Value Chart is a powerful MetaTrader 4 (MT4) indicator designed to normalize price movements and identify overbought (OB) and oversold (OS) conditions. It transforms raw price data into a standardized "value" scale, making it easier to spot extreme market conditions and potential reversals.
This indicator is ideal for:
✔ Swing Traders – Helps identify optimal entry/exit points.
✔ Mean-Reversion Strategies – Detects OB/OS zones for reversals.
✔ Trend Confirmation – Validates price strength using normalized values.
🔹 How It Works
The indicator calculates:
Normalized Price Values (based on a moving average of mid-prices).
Average True Range (ATR) for volatility adjustment.
Overbought (OB) & Oversold (OS) Levels – Customizable thresholds.
Key Features:
Visual Candlesticks – Color-coded (bullish/bearish).
Dynamic OB/OS Zones – Adjustable levels for different market conditions.
Alerts – Notifications when price enters extreme zones.
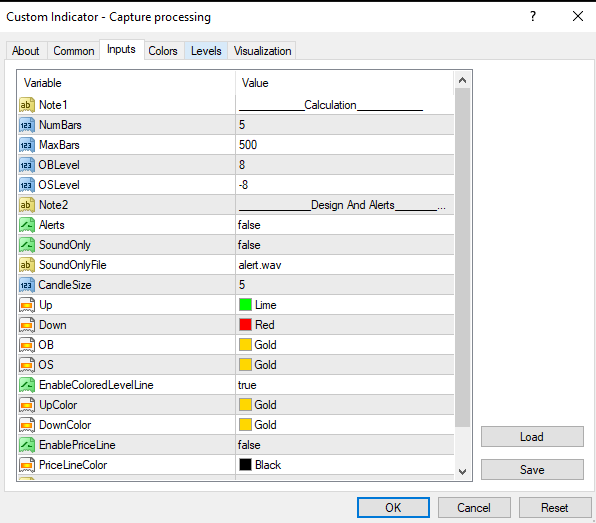
🔹 Indicator Settings
🔸 Calculation Parameters
ParameterDescription
NumBarsLookback period for MVA & ATR calculation (default: 5).
MaxBarsMaximum bars to process (default: 500).
OBLevelOverbought threshold (default: +8).
OSLevelOversold threshold (default: -8).
🔸 Design & Alerts
ParameterDescription
AlertsEnable alerts (true/false).
SoundOnlyPlay sound alerts only (true/false).
SoundOnlyFileCustom alert sound file (default: "alert.wav").
CandleSizeWidth of candlestick lines (default: 5).
UpBullish candle color (default: Lime).
DownBearish candle color (default: Red).
OBOverbought zone color (default: Gold).
OSOversold zone color (default: Gold).
🔸 Advanced Customization
ParameterDescription
EnableColoredLevelLineColor OB/OS lines (true/false).
UpColorOB line color (default: Gold).
DownColorOS line color (default: Gold).
EnablePriceLineShow current price line (true/false).
PriceLineColorPrice line color (default: Black).
HideInfoHide label info (true/false).
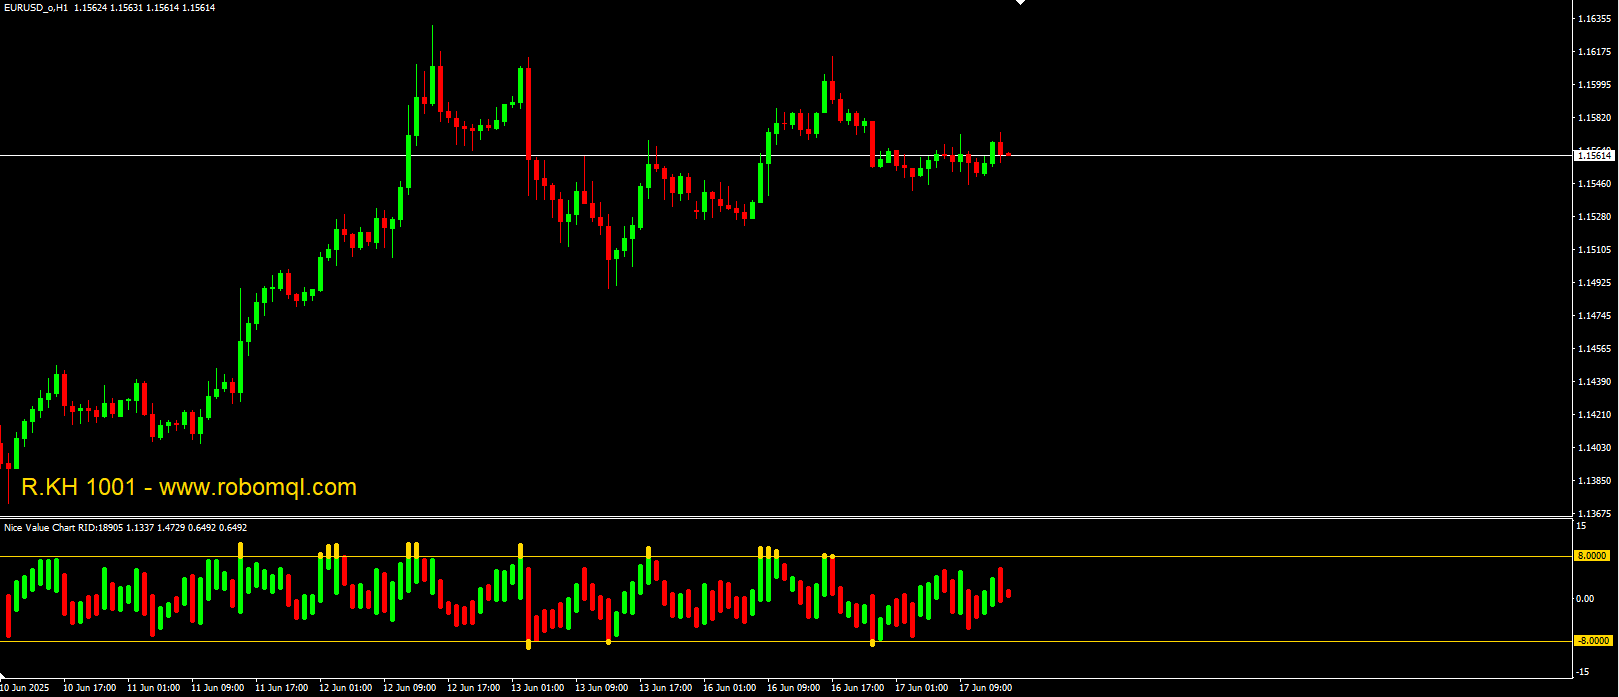
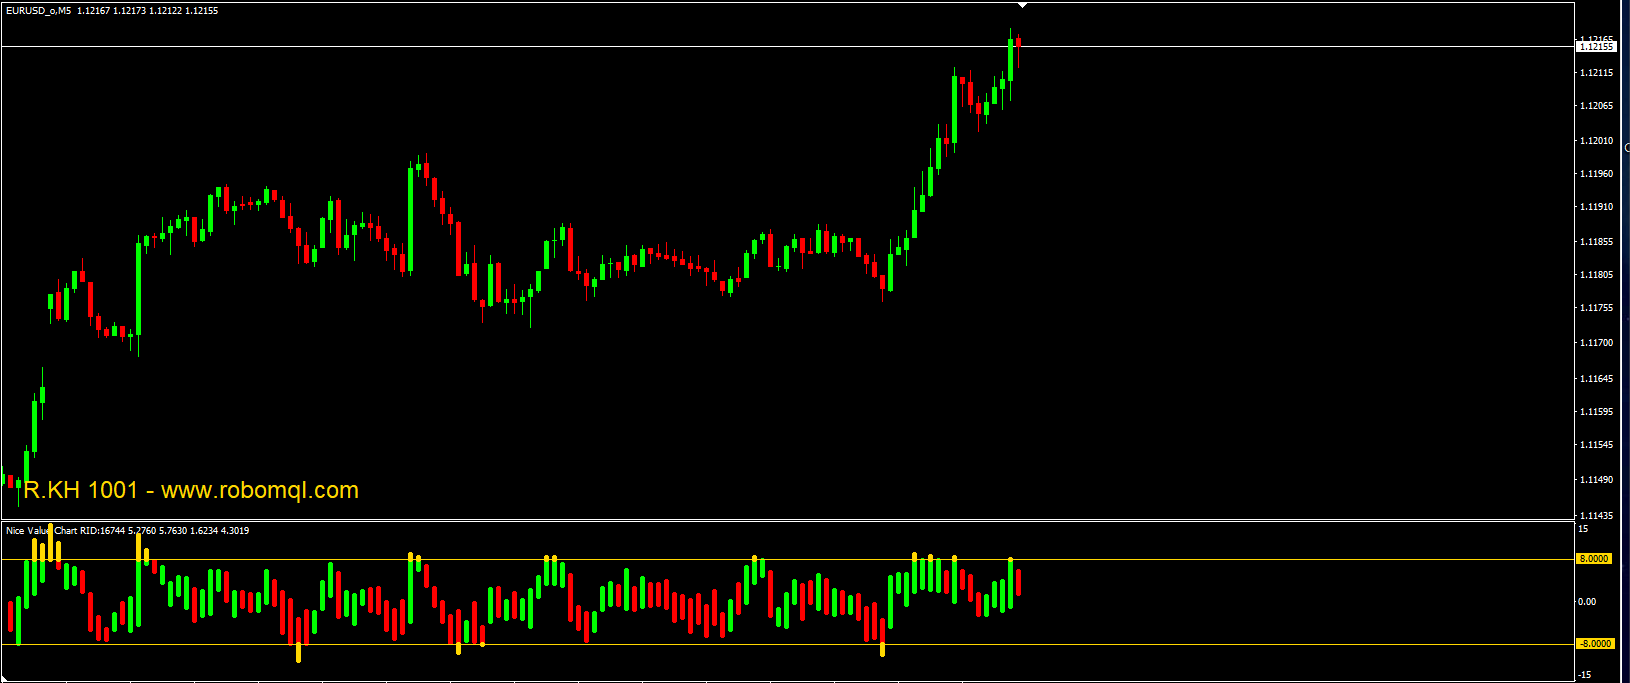
🔹 How to Use in Trading
Overbought (OB) Conditions – When price touches +8 (default), consider selling or taking profits.
Oversold (OS) Conditions – When price touches -8 (default), look for buying opportunities.
Trend Confirmation – If price remains above/below the midline (0), it confirms bullish/bearish momentum.
Divergence Detection – If price makes a new high but the indicator does not, it may signal a reversal.
🔹 Alert System
Sound Alert: Plays alert.wav when OB/OS levels are hit.
Popup Alert: Displays a message on the screen.
Email Alert: (If enabled via MT4 settings).
Example Alert:
*"EURUSD M15 – OverBought. Value: +8.50"*
🔹 Developer & Source
Developer: R.KH 1001
Website: https://www.robomql.com
Final Words
The Nice Value Chart simplifies price analysis by converting raw data into a normalized format, helping traders make smarter, data-driven decisions. Whether you're a scalper, swing trader, or long-term investor, this tool enhances your ability to spot high-probability trades.
🚀 Trade with Confidence – Let the Nice Value Chart Guide Your Way! 🚀