

Squeeze MA Indicator - Comprehensive Guide
🏆 Motto:
"Trade with precision, ride the trend, and let the Squeeze MA reveal the market's hidden opportunities!"
📌 Overview
The Squeeze MA (Moving Average) Indicator is a powerful tool designed to identify potential trend reversals and market squeeze conditions. It combines two moving averages (short-term and long-term) with a dynamic threshold (either ATR-based or fixed pips) to highlight periods of low volatility and potential breakout zones.
🔹 Key Features:
Dual MA System: Uses two customizable MAs (EMA, SMA, SMMA, LWMA).
Dynamic Threshold: Adjustable via ATR or fixed pips for adaptive market conditions.
Multi-Timeframe Support: Works on any chart timeframe.
Visual Signals: Displays upper/lower bands to indicate squeeze conditions.
⚙️ Indicator Settings & Parameters
1️⃣ Moving Average 1 (Short-Term MA)
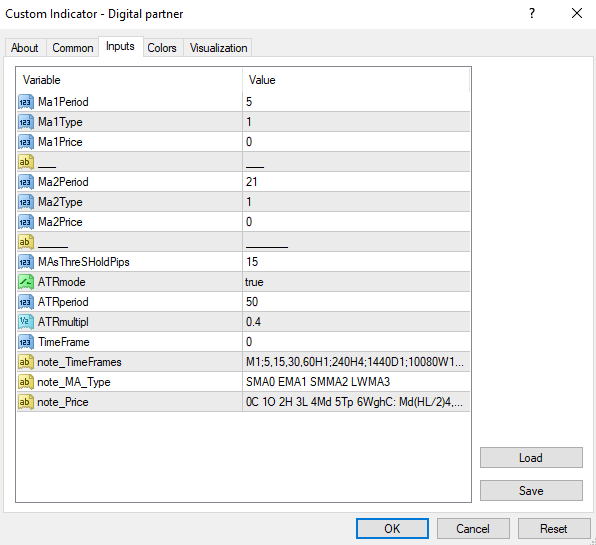
Ma1Period (Default: 5) – Period of the first MA.
Ma1Type (Default: MODE_EMA) – Type of MA (0-SMA, 1-EMA, 2-SMMA, 3-LWMA).
Ma1Price (Default: PRICE_CLOSE) – Price applied (0-Close, 1-Open, 2-High, 3-Low, etc.).
2️⃣ Moving Average 2 (Long-Term MA)
Ma2Period (Default: 21) – Period of the second MA.
Ma2Type (Default: MODE_EMA) – Type of MA.
Ma2Price (Default: PRICE_CLOSE) – Price applied.
3️⃣ Squeeze Threshold
MAsThreSHoldPips (Default: 15) – Fixed pip distance for squeeze detection.
ATRmode (Default: true) – If true, uses ATR for dynamic threshold.
ATRperiod (Default: 50) – ATR calculation period.
ATRmultipl (Default: 0.4) – ATR multiplier for threshold adjustment.
4️⃣ Timeframe Settings
TimeFrame (Default: 0 – Current chart) – Allows analysis on higher timeframes.
📊 How It Works?
Calculates Two MAs:
A fast MA (Ma1Period) and a slow MA (Ma2Period).
Detects Squeeze Condition:
If the distance between MAs is less than the threshold (either fixed pips or ATR-based), the market is in a "squeeze."
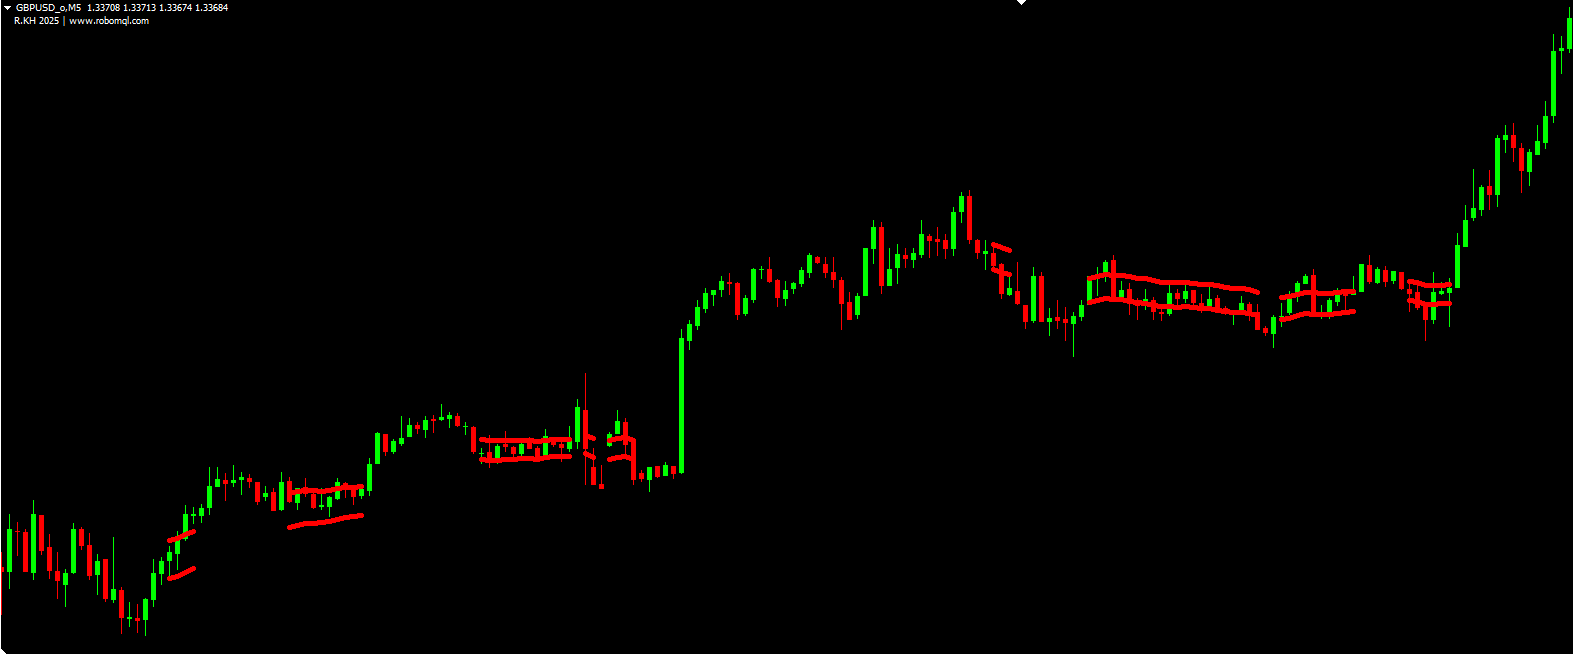
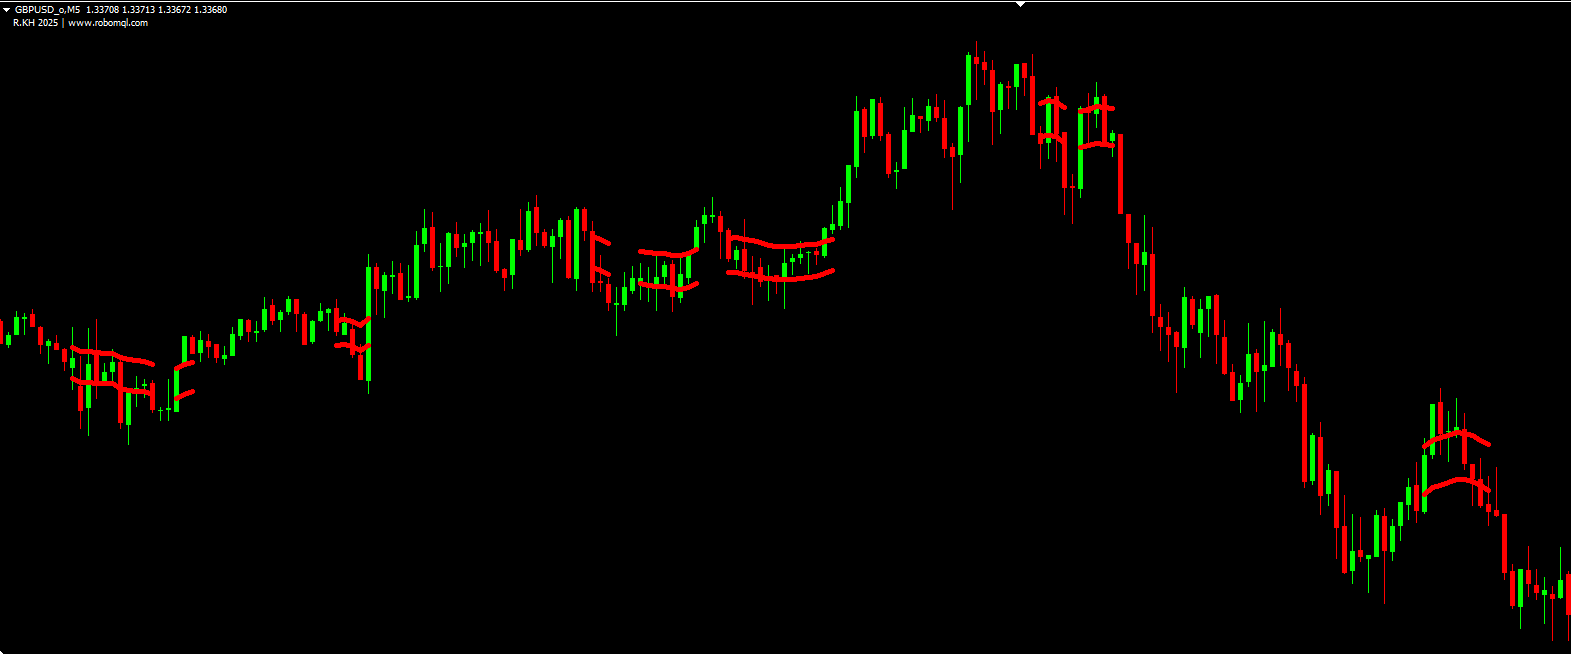
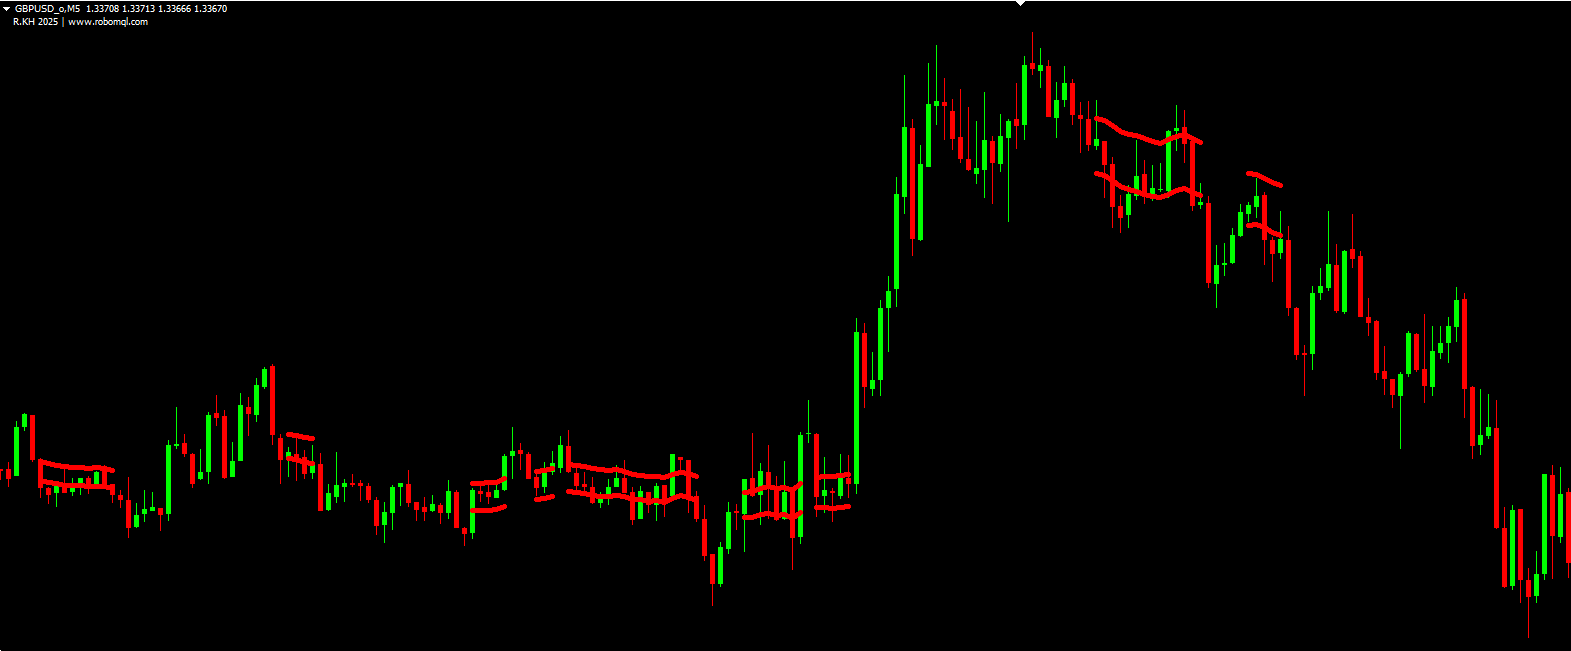
Plots Upper & Lower Bands:
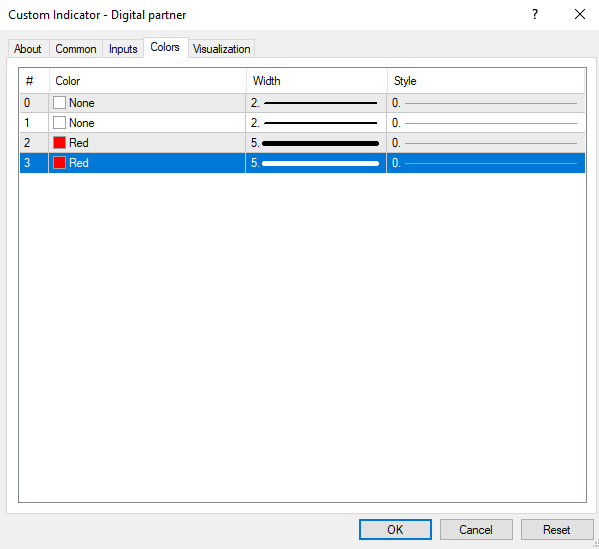
SqLup (Red Line) → Upper boundary (MA2 + Threshold).
SqLdn (Red Line) → Lower boundary (MA2 - Threshold).
Breakout Signal:
When price moves outside the bands, it suggests a potential trend continuation or reversal.
🎯 Trading Applications
✅ Trend Identification:
MA crossover signals trend direction.
✅ Volatility Squeeze Detection:
Narrow bands indicate low volatility → potential breakout ahead.
✅ Multi-Timeframe Confirmation:
Apply on higher timeframes for stronger signals.
📌 Developer & Source
Developer: R.KH (2025)
Source: RoboMQL
🚀 Final Words
The Squeeze MA Indicator is a versatile tool for traders looking to capitalize on volatility contractions and trend shifts. By fine-tuning the MA periods and threshold settings, you can adapt it to various trading styles (scalping, swing, or position trading).
Happy Trading! 📈