
Evolved Dog TMA Slope Indicator
"Track Market Momentum Like a Bloodhound – Never Lose the Scent of Profit!"
🔹 Overview
The Evolved Dog TMA Slope Indicator is a sophisticated momentum oscillator for MetaTrader 4 that visualizes:
✔ Triangular Moving Average (TMA) Slope – Smoothed trend strength
✔ ATR-Normalized Values – Adjusts for market volatility
✔ Multi-Timeframe Analysis – Compare trends across different charts
Ideal for traders who want to:
Identify trend strength/direction
Spot overbought/oversold conditions
Confirm breakouts/reversals
🔹 How It Works
Calculates TMA Slope:
Uses a weighted triangular moving average for smooth trend detection
Compares current vs. previous TMA values
Normalizes with ATR:
Divides slope by 10% of ATR(100) to account for volatility
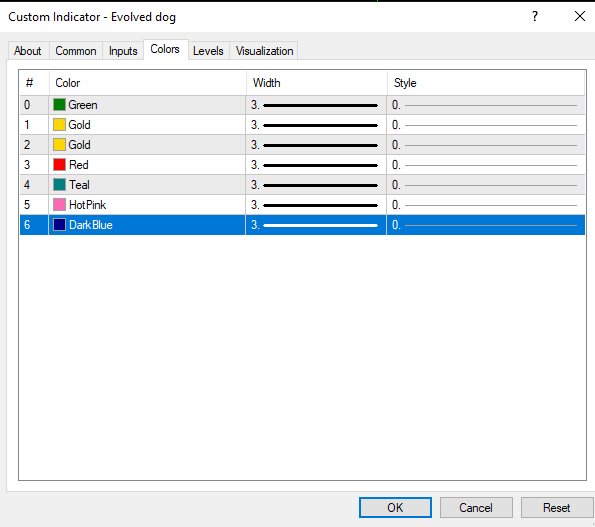
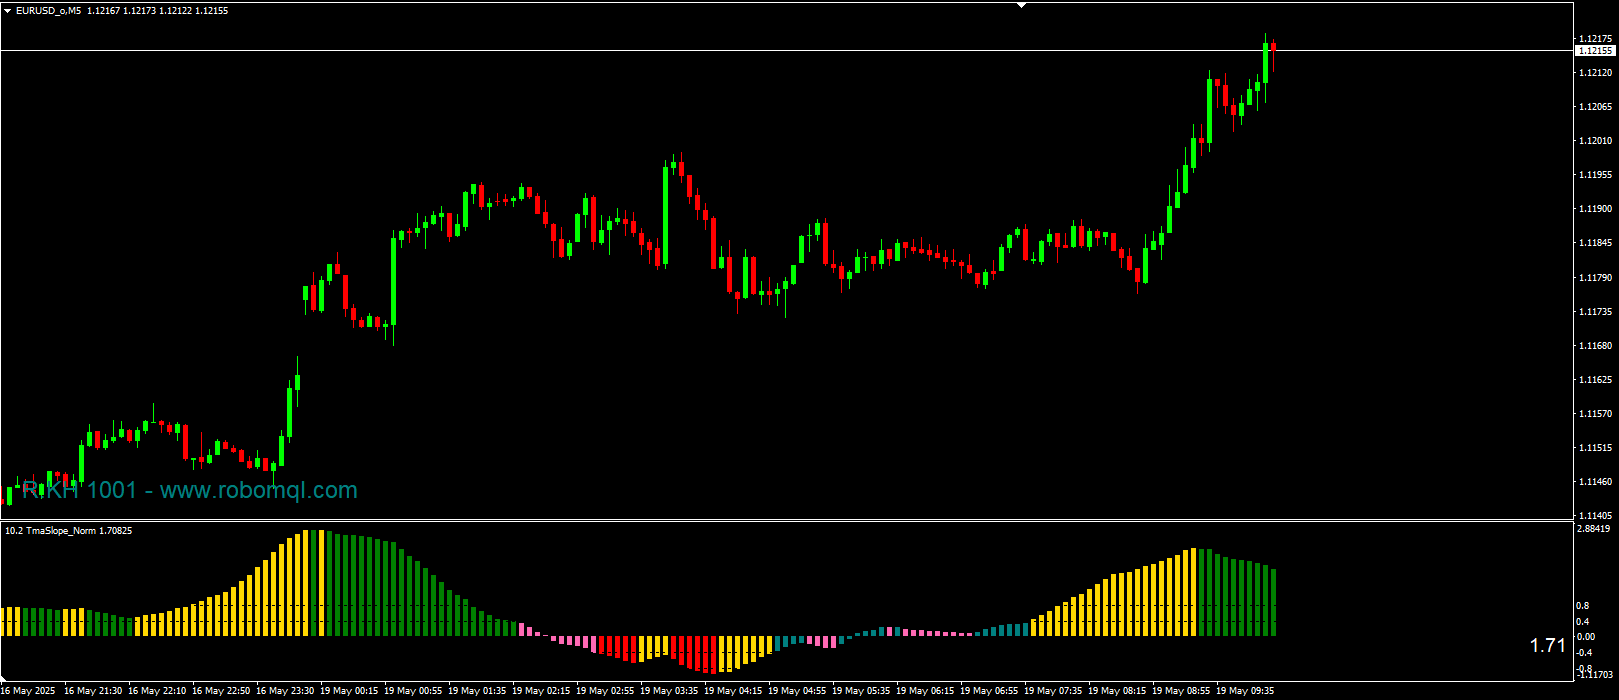
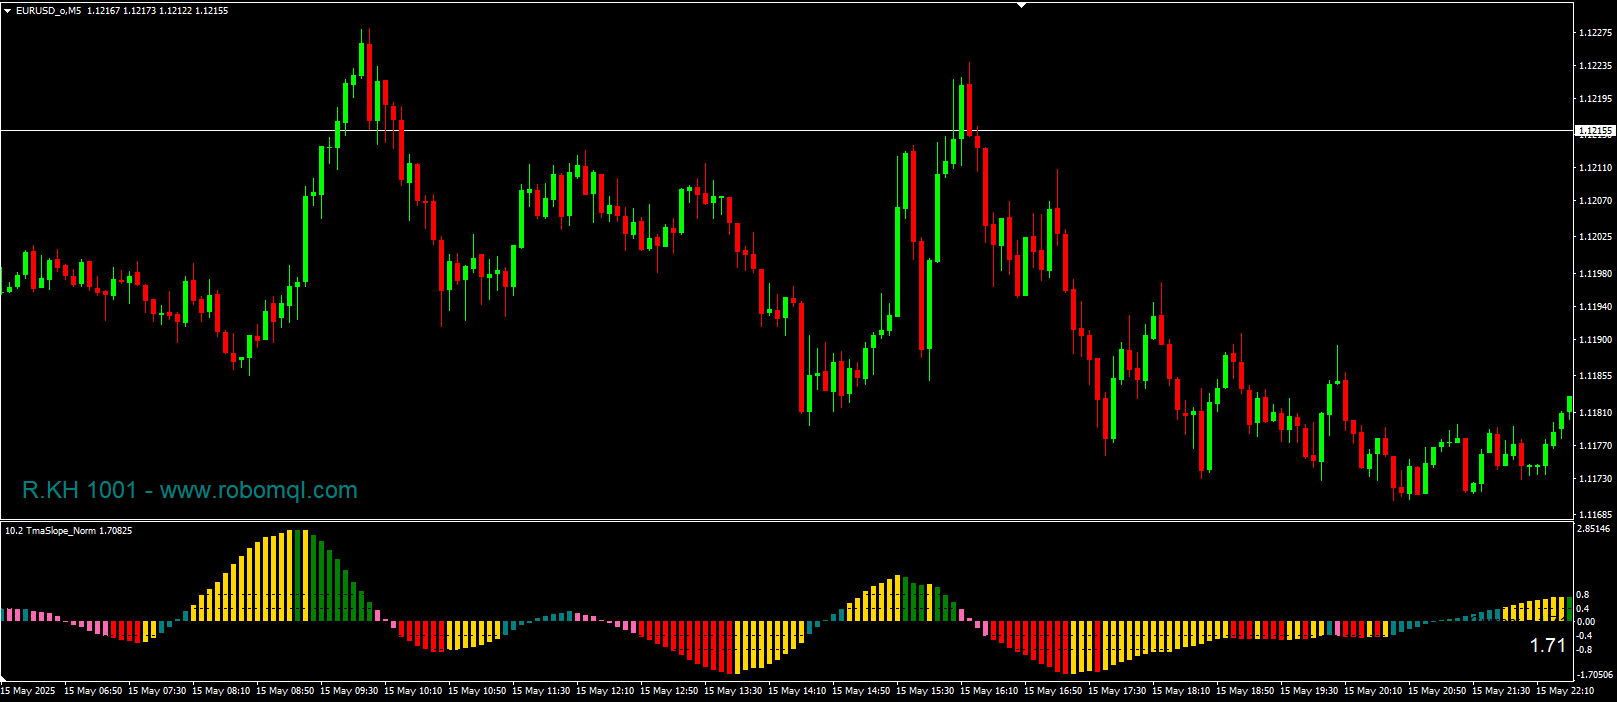
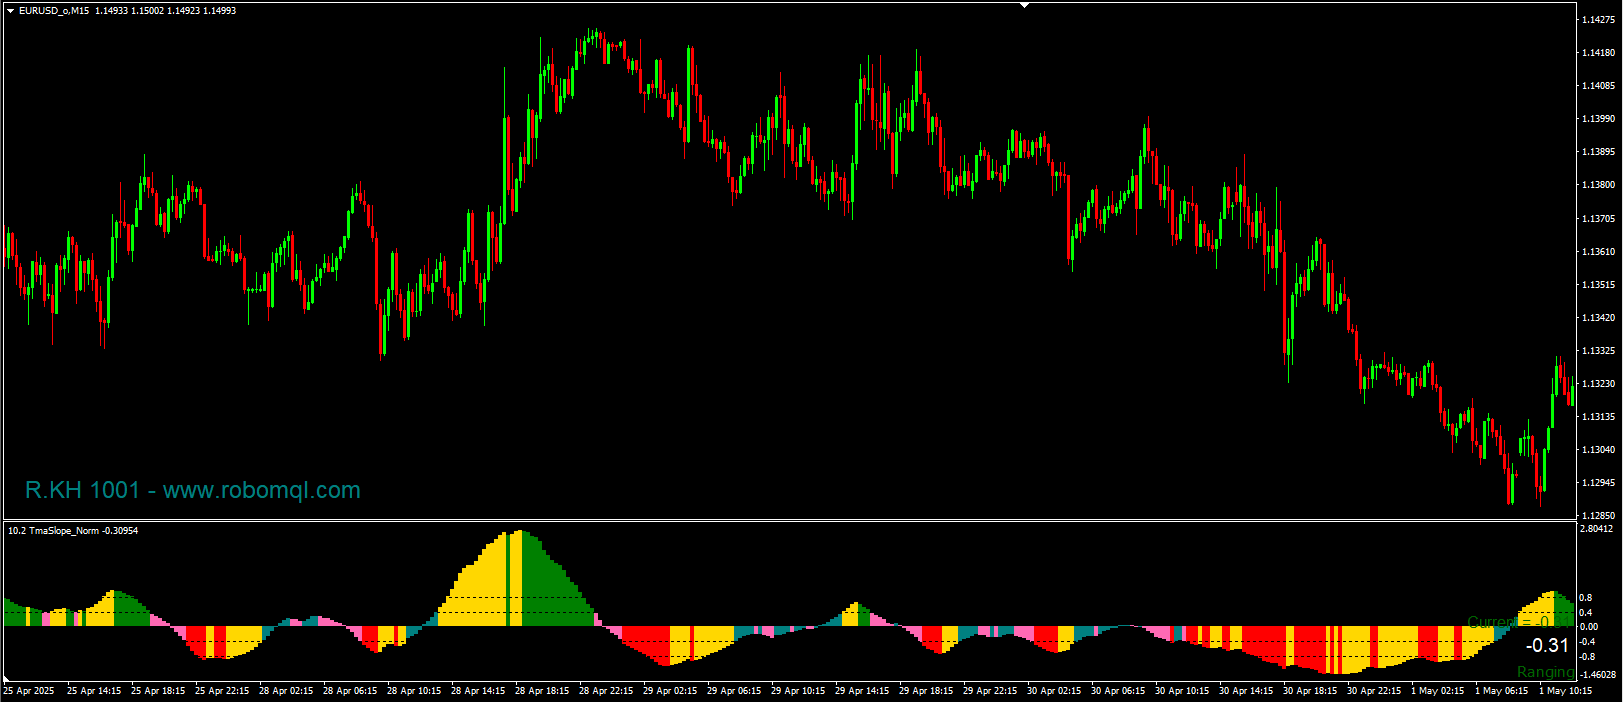
Visualizes Momentum:
Green/Red Histograms: Strong bullish/bearish momentum
Gold Histograms: Weakening momentum
Text Labels: Real-time slope values & trading signals
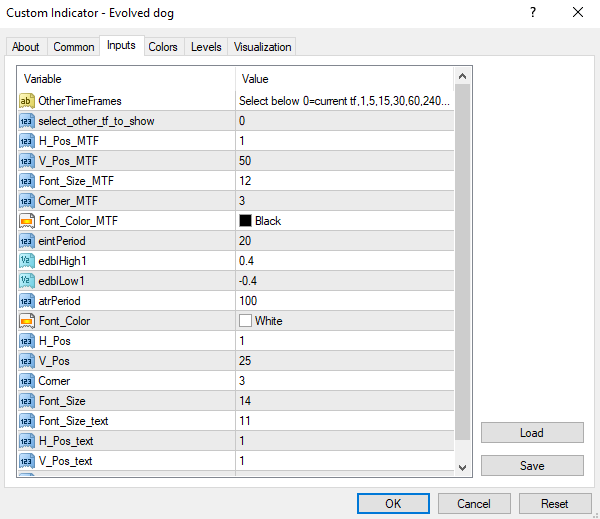
🔹 Indicator Settings
🔸 Core Parameters
ParameterDescription
eintPeriodTMA calculation period (Default: 20)
edblHigh1Upper threshold (Default: 0.4)
edblLow1Lower threshold (Default: -0.4)
atrPeriodATR period for normalization (Default: 100)
🔸 Multi-Timeframe Display
ParameterFunction
select_other_tf_to_showChoose timeframe to compare (0=Current)
Font_Color_MTFColor-coded MTF slope (Green/Red/Black)
🔸 Visual Customization
ParameterEffect
Font_SizeMain slope value text size
H_Pos/V_PosText position adjustments
🔹 How to Use in Trading
1. Trend Identification
Strong Uptrend: Slope 0.8 (Dark Green)
Strong Downtrend: Slope -0.8 (Dark Red)
Ranging Market: Slope between -0.4 and 0.4 (Gold)
2. Trading Signals
Buy: Slope crosses above 0.4 + Histogram turns green
Sell: Slope crosses below -0.4 + Histogram turns red
3. Multi-Timeframe Confirmation
Check higher timeframe slope (e.g., H4/D1) for confluence
🔹 Trading Strategies
▶ Momentum Breakout
Enter long when slope breaks 0.8 with rising histogram
Enter short when slope breaks -0.8 with falling histogram
▶ Mean Reversion
Fade extremes near ±0.8 when price hits S/R levels
▶ Divergence Trading
Price makes lower low but slope makes higher low = Bullish reversal
Price makes higher high but slope makes lower high = Bearish reversal
🔹 Alert System
Text Alerts: "Buy Only"/"Sell Only"/"Ranging" labels
Visual Alerts: Color changes in MTF display
🔹 Developer & Source
Original Developer: R.KH 1001
Website: https://www.robomql.com
Final Words
The Evolved Dog TMA Slope Indicator combines trend detection, volatility adjustment, and multi-timeframe analysis into one powerful tool. Whether you're a day trader or swing trader, its intuitive visual signals help you ride trends with confidence.
🐕 Let This Indicator Be Your Guide – Sniff Out Profits Like a Pro! 🐕