
Detailed Explanation of the "Fast Money" fast money
This custom indicator is a modified version of the Stochastic Oscillator, designed to provide clear trading signals with visual enhancements. Below is a complete breakdown of its features, calculations, and usage.
1. General Overview
Indicator Name: Fast Money
Developer: Reza
Platform: MetaTrader 4 (MT4)
Type: Separate window oscillator (0-100 scale)
Main Purpose: Identifies overbought/oversold conditions and potential trend reversals.
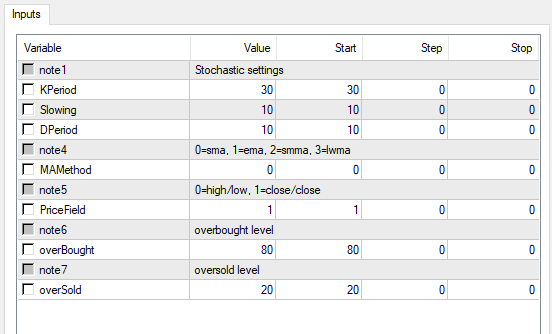
2. Input Parameters
Stochastic Settings
KPeriod (Default: 30) – The lookback period for %K (fast line).
Slowing (Default: 10) – Smoothing applied to %K.
DPeriod (Default: 10) – The moving average period for %D (slow line).
Moving Average Method
MAMethod (0-3) – Defines the type of MA used for smoothing:
0 = SMA (Simple Moving Average)
1 = EMA (Exponential Moving Average)
2 = SMMA (Smoothed Moving Average)
3 = LWMA (Linear Weighted Moving Average)
Price Field
PriceField (0-1) – Determines the price source for calculations:
0 = High/Low (Traditional Stochastic method)
1 = Close/Close (Alternative method using closing prices)
Overbought/Oversold Levels
overBought (Default: 80) – Upper threshold for overbought conditions.
overSold (Default: 20) – Lower threshold for oversold conditions.
3. Indicator Buffers
The indicator uses 4 buffers (arrays storing calculated values):
Buffer IndexNameDescriptionColorStyle
0DFull%D (Slow line)DimGrayLine (if DPeriod 1)
1KFull%K (Fast line)DimGrayLine
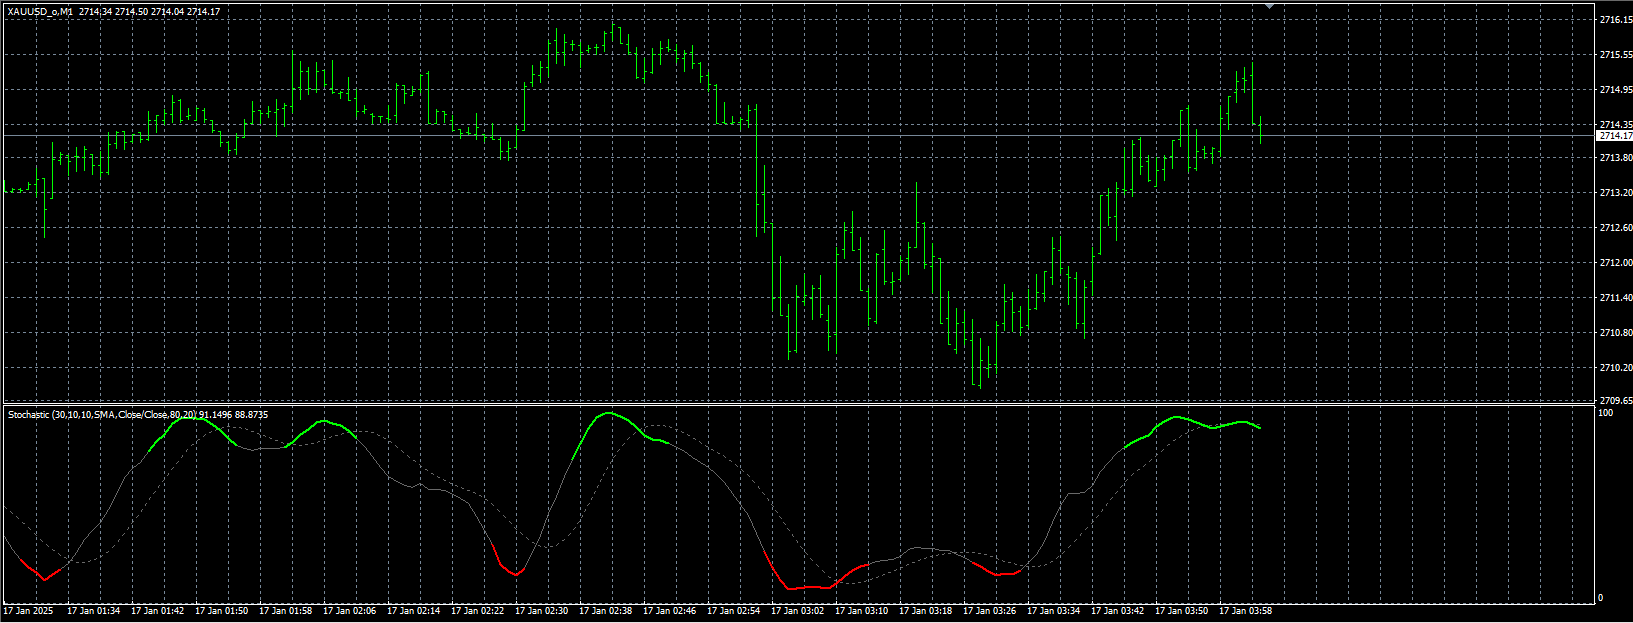
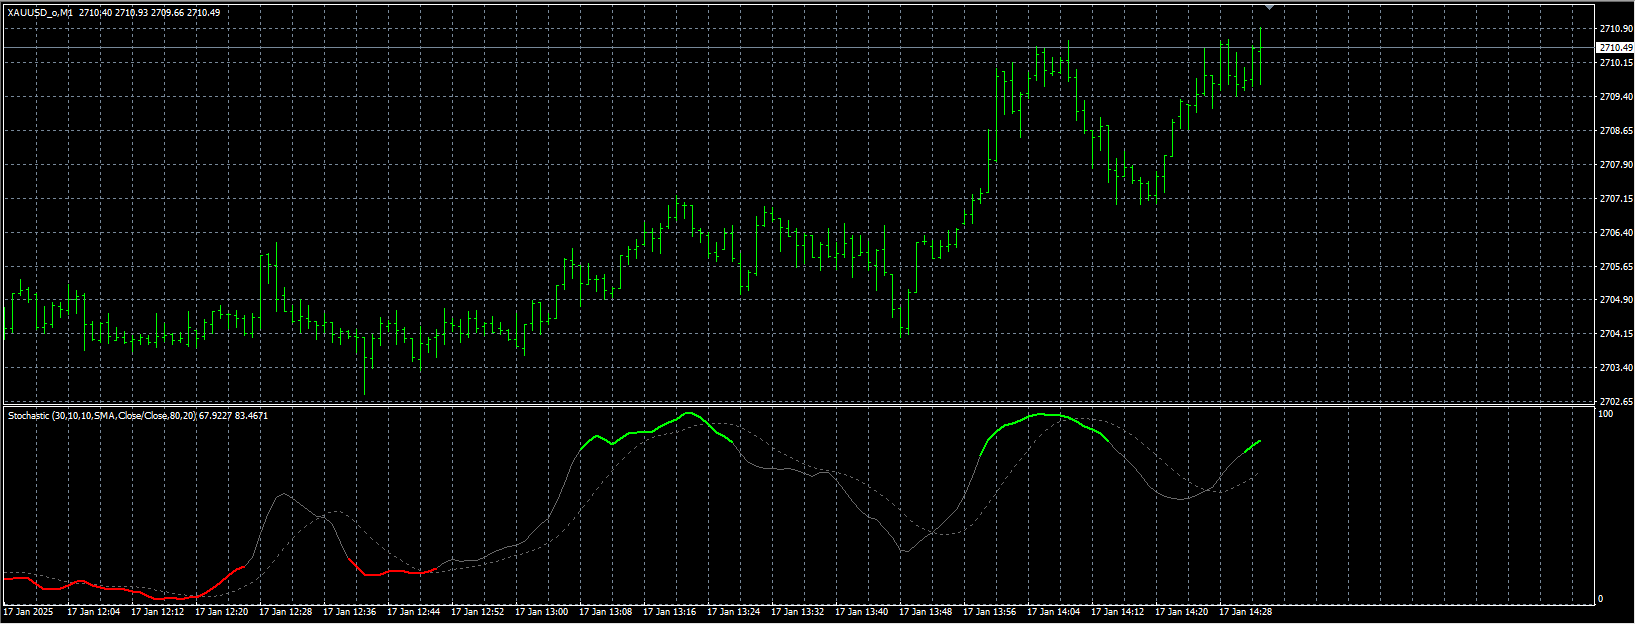
2UpperOverbought zone highlightsLimeThick Line
3LowerOversold zone highlightsRedThick Line
4. How It Works
Calculation Logic
%K (Fast Line):
Calculated using iStochastic() with the specified KPeriod, Slowing, and MAMethod.
If PriceField = 0, it uses High/Low prices.
If PriceField = 1, it uses Close/Close prices.
%D (Slow Line):
A moving average of %K (DPeriod determines smoothing).
If DPeriod = 1, the slow line is hidden.
Overbought/Oversold Highlighting:
When %K overBought (80), the Upper buffer marks the value in Lime.
When %K overSold (20), the Lower buffer marks the value in Red.
Visual Enhancements
Thick Lines: Overbought/oversold levels are highlighted with thicker lines.
Dynamic Plotting: Only shows highlights when conditions are met (avoids cluttering).
5. Trading Signals
Buy Signal (Oversold)
When %K crosses above overSold (20) → Potential bullish reversal.
Confirmation: %K crosses above %D (bullish crossover).
Sell Signal (Overbought)
When %K crosses below overBought (80) → Potential bearish reversal.
Confirmation: %K crosses below %D (bearish crossover).
Divergence Detection
Bullish Divergence: Price makes lower lows, but Stochastic makes higher lows.
Bearish Divergence: Price makes higher highs, but Stochastic makes lower highs.
6. Recommended Settings
Trend-Following: KPeriod=35, Slowing=10, DPeriod=1 (for smoother signals).
Scalping: KPeriod=14, Slowing=3, DPeriod=3 (faster reactions).
Default: KPeriod=30, Slowing=10, DPeriod=10 (balanced approach).
7. Advantages
✅ Clear Visuals: Overbought/oversold zones are highlighted for easy spotting.
✅ Customizable Smoothing: Adjust MA type for different market conditions.
✅ Flexible Price Input: Choose between High/Low or Close/Close calculations.