

×
![]()
Fibonacci Retracement Indicator
Fibonacci retracement is a method of technical analysis for determining support and resistance levels. They are named after their use of the Fibonacci sequence. Fibonacci retracement is based on the idea that markets will retrace a predictable portion of a move, after which they will continue to move in the original direction.
CATEGORIES: TREND, MT4, INFORMATIONAL
Updated on: 25.11.2023
Most likely, you have repeatedly seen before that it becomes difficult to distinguish the trend waves from the retracement ones due to the strong volatility in the Forex market.
To correct this problem, a free Fibonacci Retracement indicator was developed. You can check it out in this article.
Contents:
1. Description of the indicator
2. Description of the Fibonacci levels
3. How to use the indicator
1. Description of the indicator Fibonacci (Fibo) Retracement
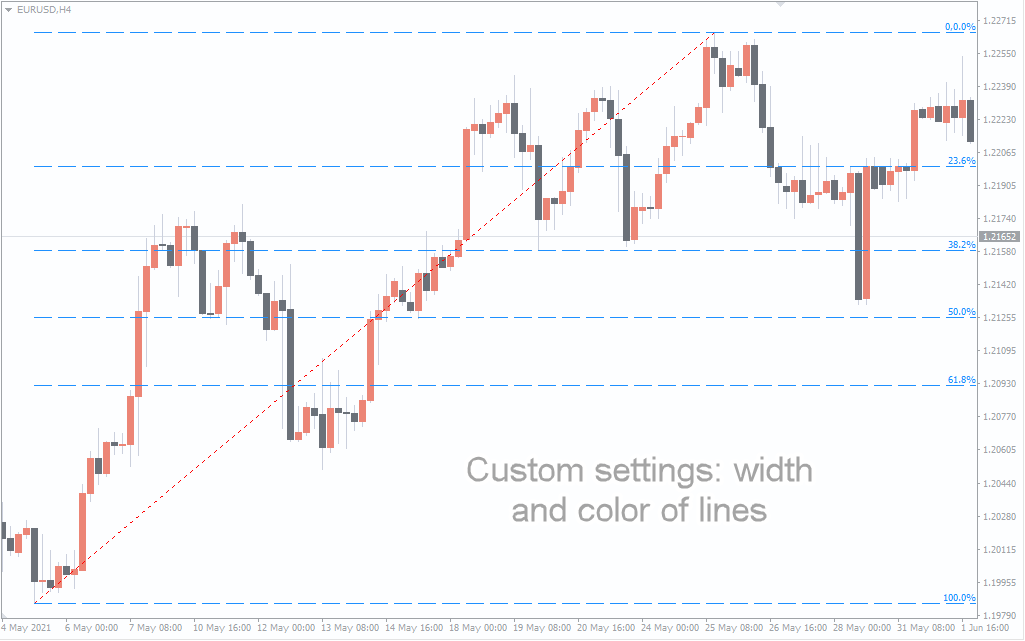
The indicator automatically draws the Fibonacci levels (the Fibo extensions) on the MT4 chart. In doing so, it filters out the “flat market” stage and takes into account only the phases of active price movement.
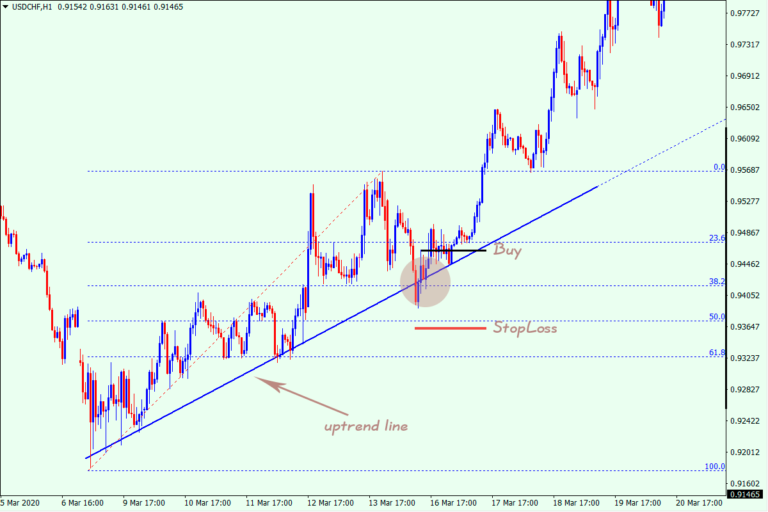
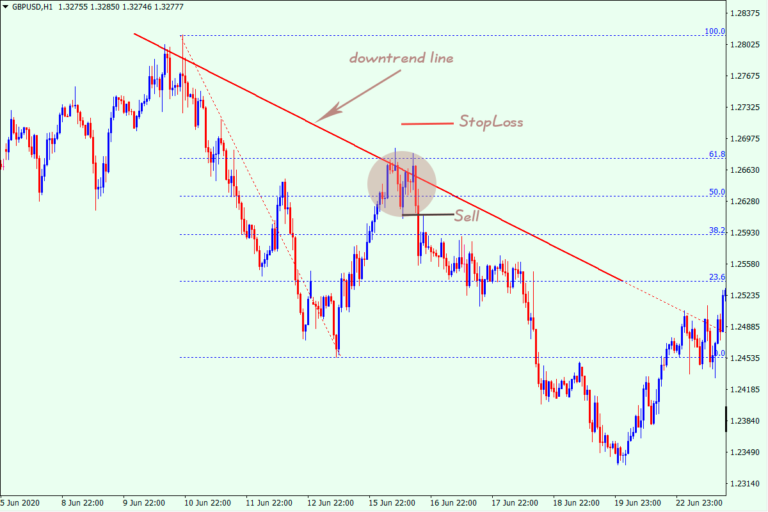
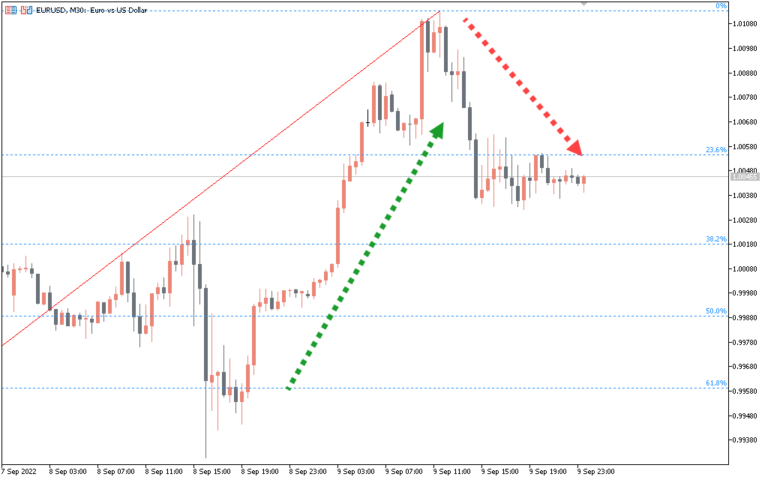
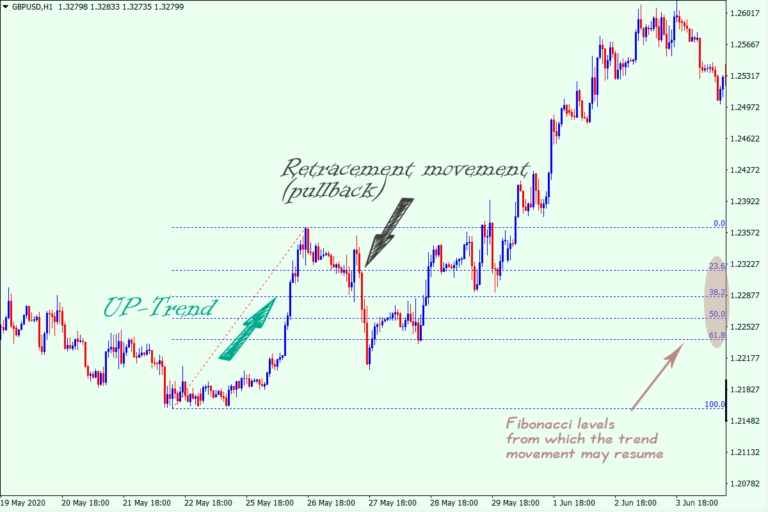
The Fibo extensions help to determine possible depth of retracement (pullback) in relation to the primary trend. With the levels, you can spot those pivot points (or pivots), from which the primary trend will more likely resume.
The principle behind the Fibo levels is that the deeper the pullback, the higher the chances pivot points will occur towards the prevailing trend.
Promotion:
2. Description of the Fibonacci levels
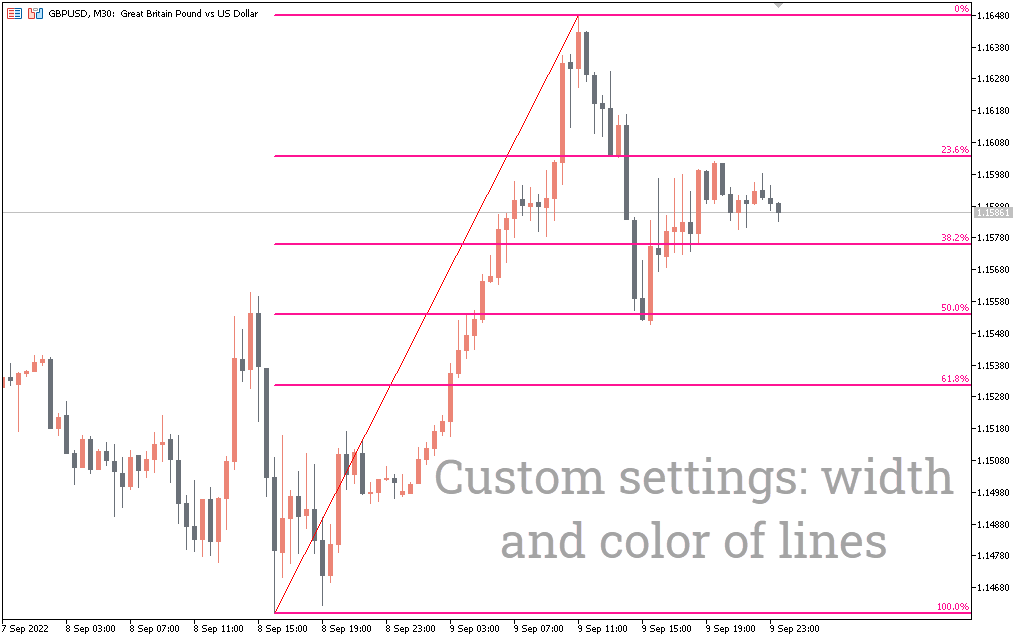
The Fibonacci extensions are shown as percentages and calculated as follows: set the Fibo grid (shown as the values from 0% to 100%) to display the percentage values of 23.6, 38.2, 50.0, and 61.8. The resulting values are used to draw the Fibonacci levels (they number 6):
100% – the starting point for the Fibonacci levels placement.
61.8% – the so-called “golden ratio”. This level is a good complement to the 50% value. So, if the pullback wave slows down around these two levels, it will make it more likely that a pivot point occurs.
50% – pivots often form near this level. This is due to the fact that short-term traders lock in profits on their positions after trading pullbacks.
38.2% – pivots form close to this level when traders are highly active and confident.
23.6% – pivots only rarely form near this level. Forex market participants often wait for a deeper retracement to identify entry points.
0% – this value is the ending point for the Fibo levels placement.
When using the Fibonacci levels in other indicators, you can see the 78.6% level. Usually, pullback waves don’t reach this value. This is explained by the fact that the trend movement recovers earlier, i.e. next to the higher levels. This is why the 78.6% extension level was removed from the FiboRetracement indicator.
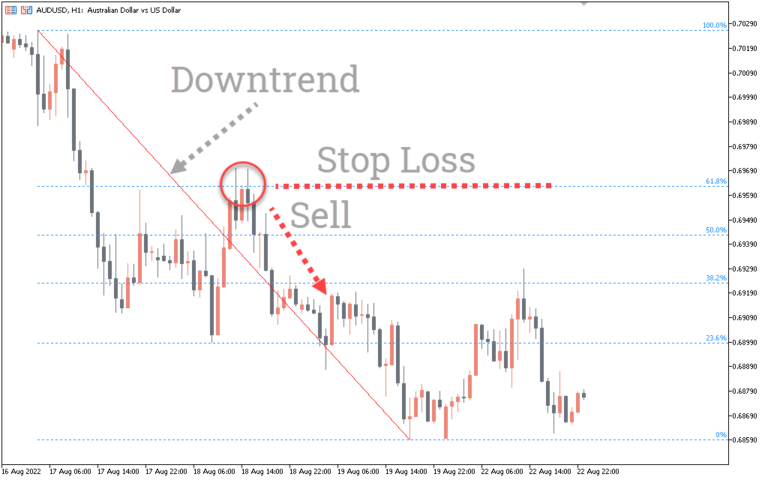
In addition to the theoretical description of the levels, you should take into account each specific situation on the chart. So, if there has been the strong trend before the retracement, and the pullback wave is weak, there is a better chance of resuming the trend.
Conversely, if the pullbacks are stronger than the primary trend, the pullback will likely turn into a new and opposite trend.
Also, if the Fibo levels align with round-number levels (see the free RoundLevels indicator) or other technical analysis tools, the chances of recovering the primary trend will be higher.