Financial Chaos Indicator - Complete Trading Guide
"Master Market Turbulence - Turn Chaos Into Consistent Profits!"
🔹 Overview
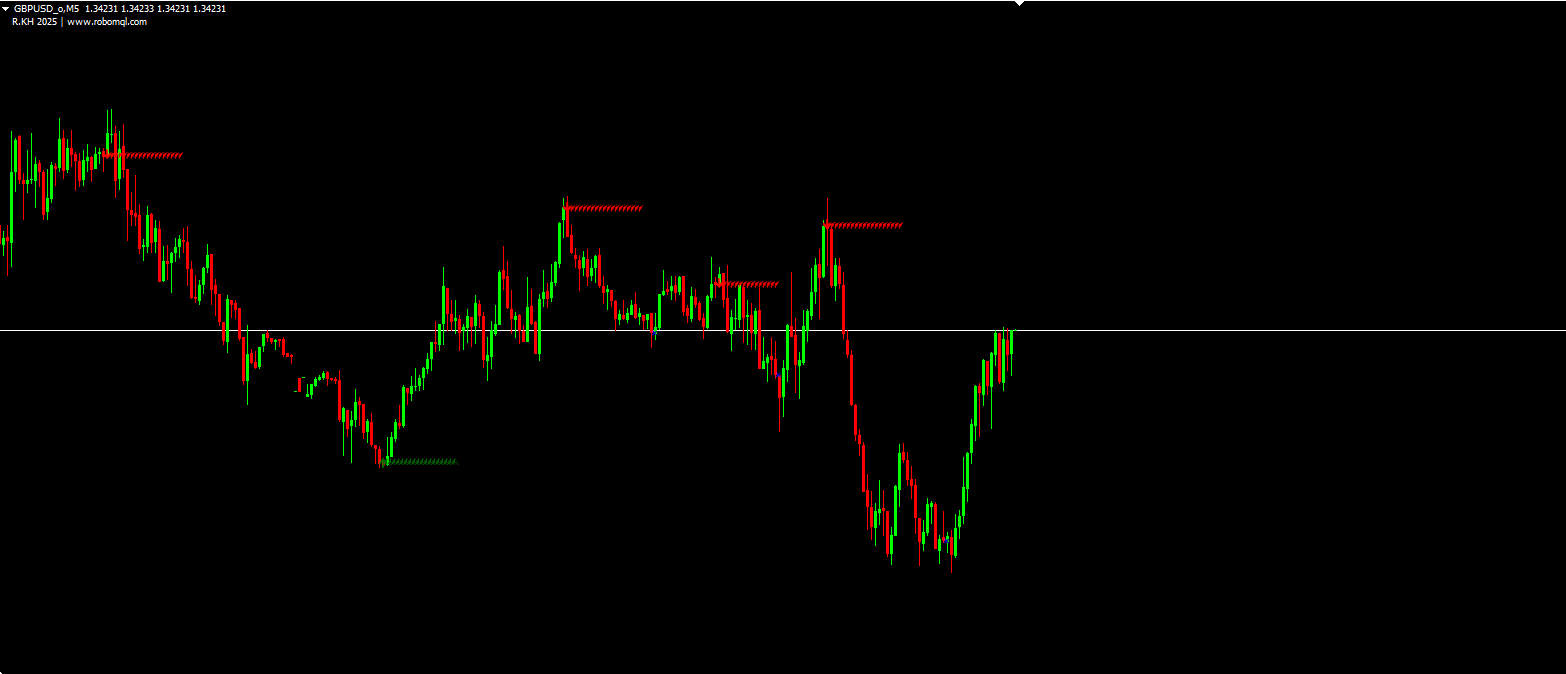
The Financial Chaos indicator is an advanced MetaTrader 4 tool that combines ZigZag patterns, moving averages, and volatility analysis to identify high-probability trend reversals and profit-taking opportunities. Designed for traders navigating volatile markets, it provides clear visual signals for entries, exits, and trend confirmation.
Key Features:
✅ Multi-Timeframe Analysis - Works across all chart periods
✅ Smart Trend Identification - Detects emerging trends early
✅ Profit-Taking Signals - Flags optimal exit points
✅ Customizable Alerts - Desktop, email, and sound notifications
✅ Visual Arrow System - Color-coded signals for easy interpretation
🔹 How It Works
The indicator uses a sophisticated algorithm that:
Analyzes Price Waves (ZigZag pattern detection)
Smooths Data (Special moving average calculations)
Identifies Extremes (Peak/trough detection)
Generates Signals (Entry/exit arrows with trend confirmation)
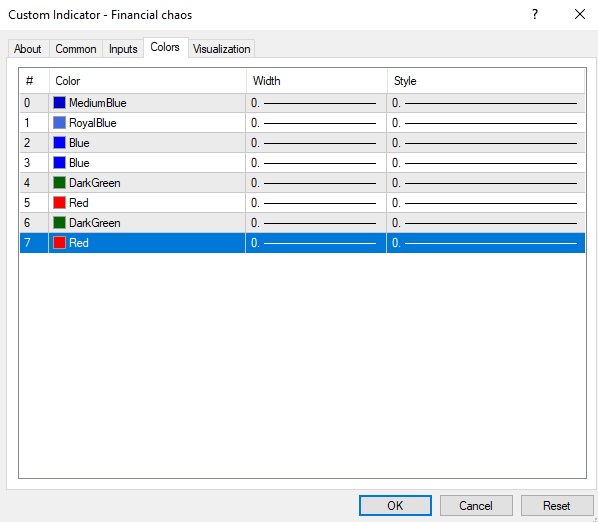
Signal Types:
🔵 Blue Up Arrow - Strong bullish trend signal
🔴 Red Down Arrow - Strong bearish trend signal
🟢 Green TP Arrow - Buy take profit signal
🟠 Orange TP Arrow - Sell take profit signal
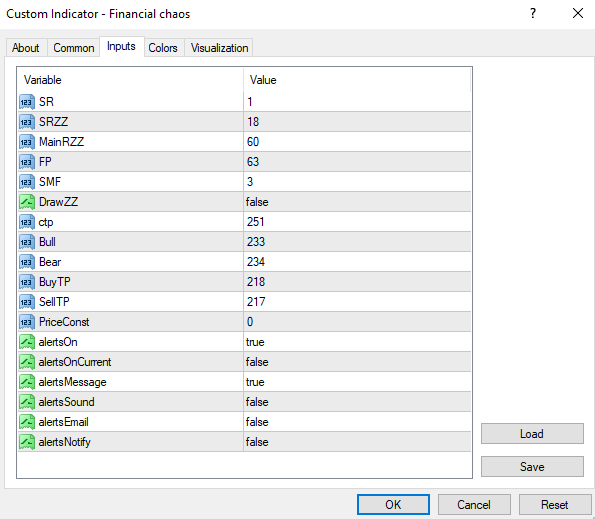
🔹 Indicator Settings & Parameters
1. Core Configuration
ParameterDefaultDescription
SR1Sensitivity of initial smoothing
SRZZ18Short-term ZigZag sensitivity
MainRZZ60Main ZigZag period
FP63Filter period for extremes
SMF3Smoothing factor multiplier
2. Visual Settings
FeatureOptionsDescription
DrawZZOn/OffToggle ZigZag lines
Arrow CodesCustomChange arrow symbols
Price Source6 optionsSelect price calculation method
3. Alert System
Trend Change Alerts - When new trend detected
TP Alerts - When profit targets reached
Notification Methods - Popup, email, sound, mobile
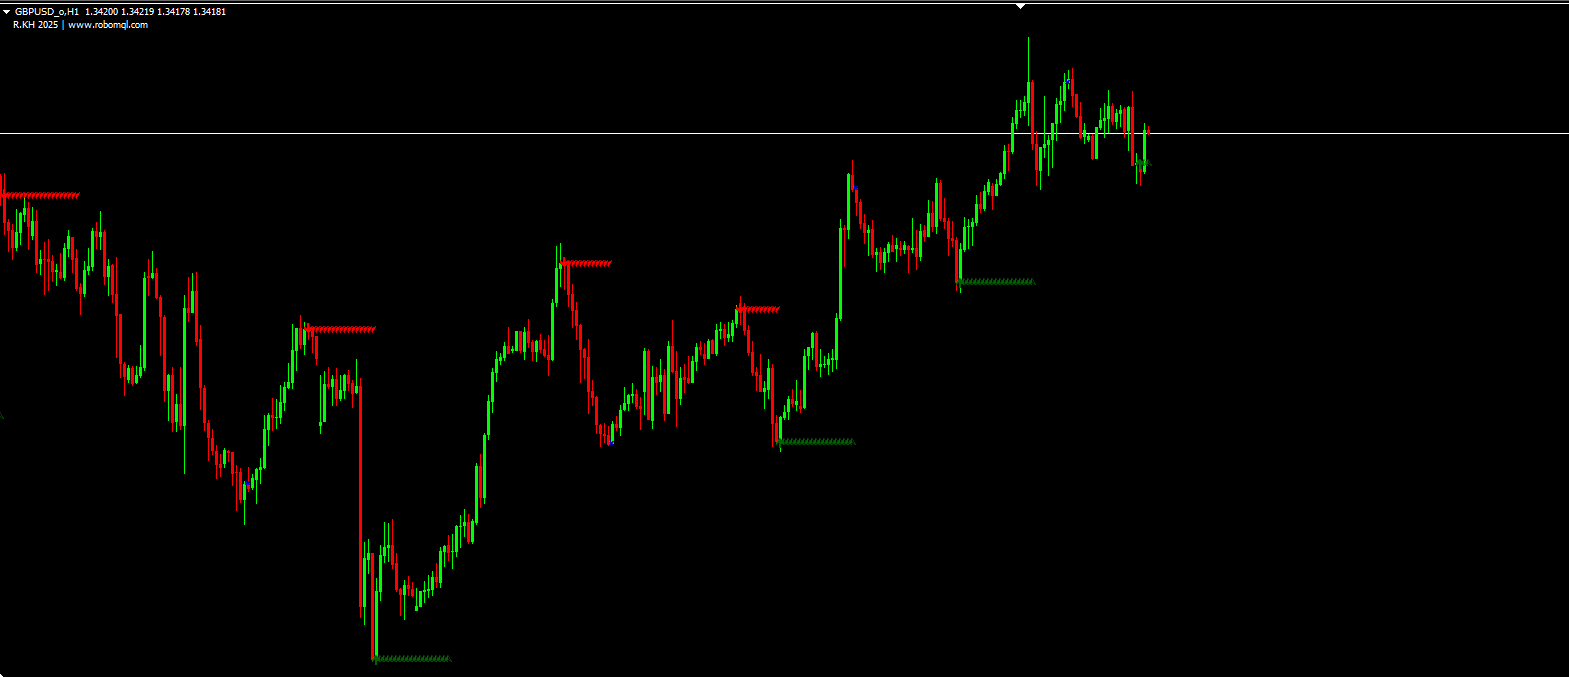
🔹 Trading Strategy Recommendations
Entry Techniques
Trend Following
Enter long when blue up arrow appears
Enter short when red down arrow appears
Confirm with ZigZag direction
Mean Reversion
Fade extremes when price reaches TP arrows
Combine with overbought/oversold indicators
Risk Management
Stop Placement - Below recent swing low (longs) / Above swing high (shorts)
Profit Targets - Use TP arrows as initial targets
Position Sizing - Reduce size in high volatility (chaotic markets)
Timeframe Combinations
Intraday - Use 5M-30M with SR=2, SRZZ=12
Swing Trading - Use H4-D1 with SR=3, SRZZ=20
Position Trading - Use W1-MN with MainRZZ=100+
🔹 Advanced Tips
Divergence Trading - Look for price/indicator divergences at extremes
Multi-Timeframe Confirmation - Check higher timeframe trend direction
News Filter - Avoid trading during high-impact news when chaos peaks
🔹 Developer & Source
Developer: R.KH
Year: 2025
Website: https://www.robomql.com
"In Market Chaos Lies Opportunity - Let This Indicator Be Your Guide Through the Storm!" 🌪️📈