
Flight Channels Indicator – Complete Guide
Indicator Overview
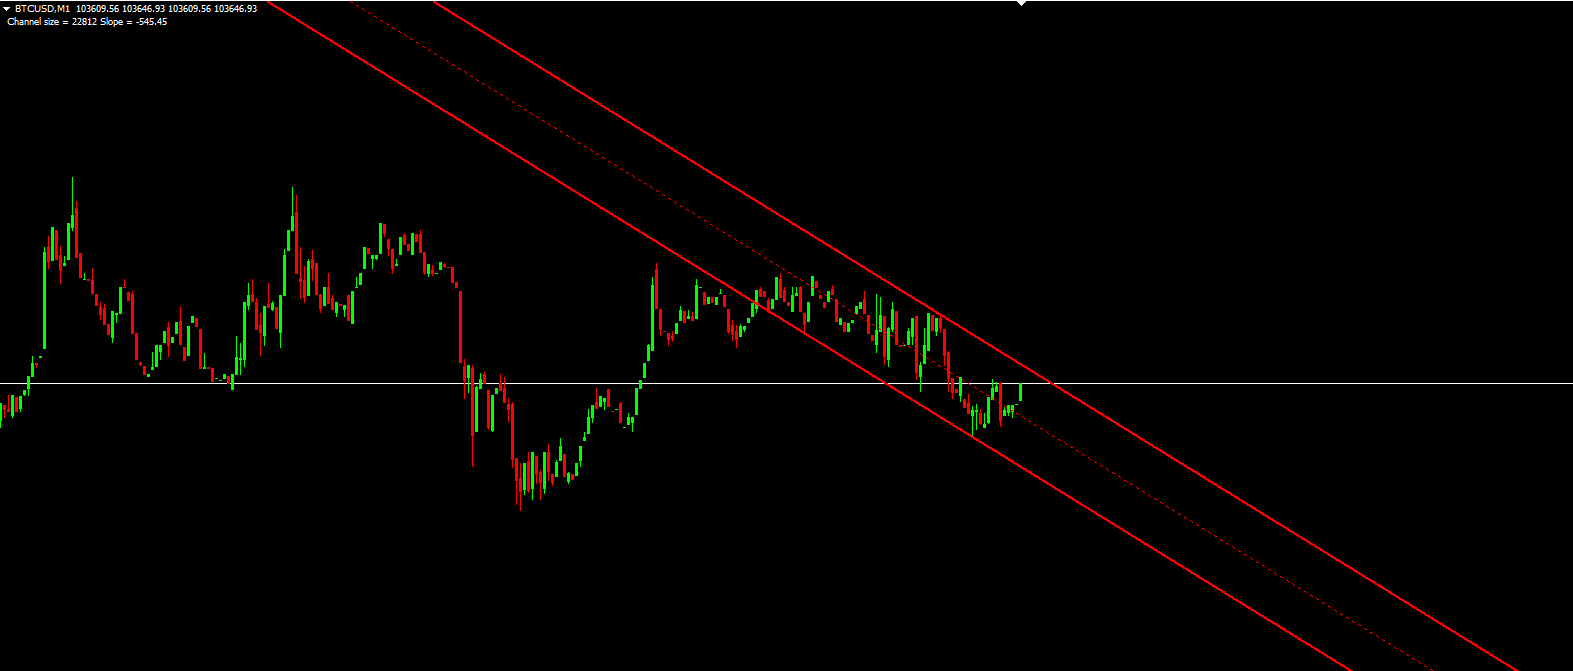
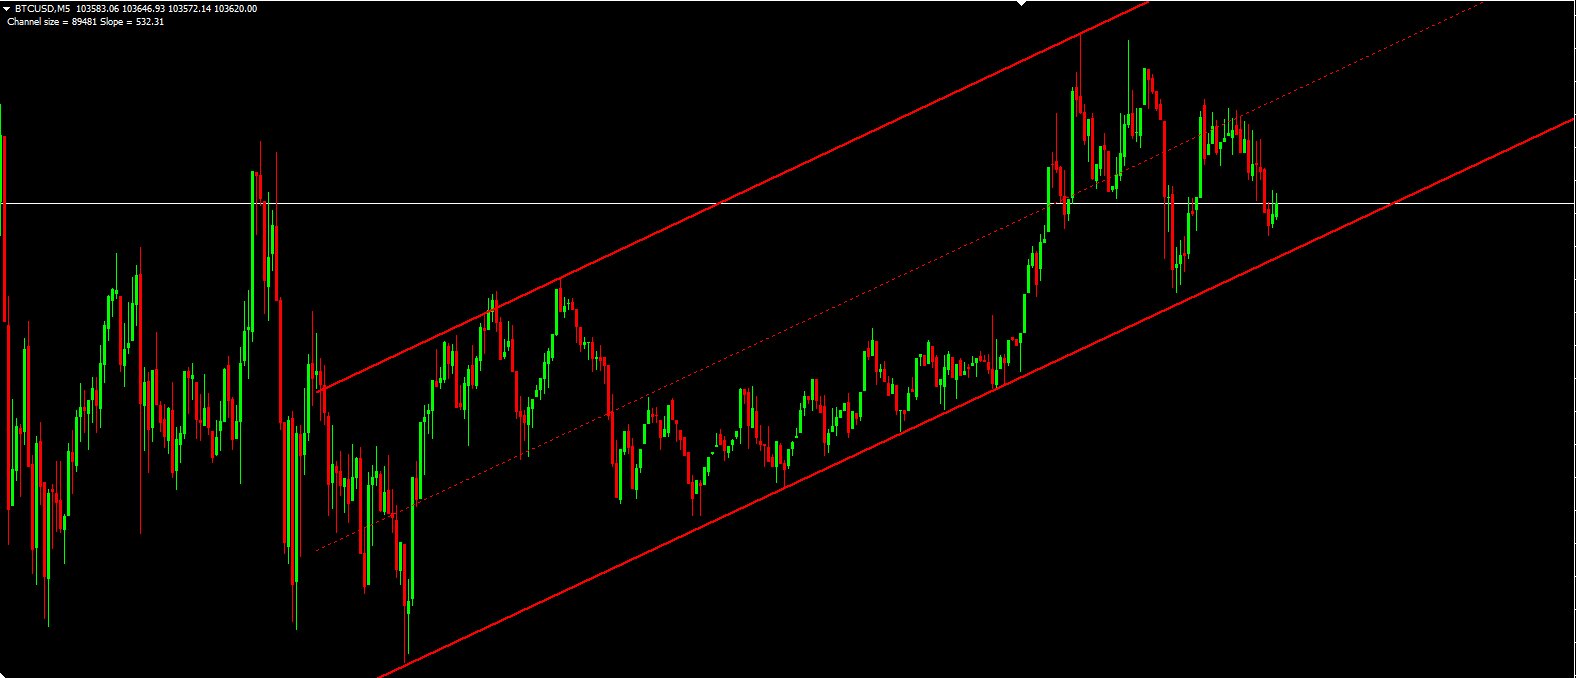
The Flight Channels indicator is a trend channel tool designed to identify price channels and potential breakout/breakdown points. It automatically draws three lines on the chart:
Upper Channel Line (Resistance)
Lower Channel Line (Support)
Middle Line (Median reference)
This indicator is useful for trend traders, swing traders, and breakout traders looking to catch price movements within established channels.
How the Flight Channels Indicator Works
The indicator scans recent price history to detect fractal points (swing highs and lows).
It then calculates the slope of the trend and draws parallel lines to form a price channel.
The middle line acts as a dynamic support/resistance level.
Breakouts above/below the channel can signal trend reversals or continuations.
Key Features:
✅ Automatically Adjusting Channels – Adapts to changing market conditions.
✅ Fractal-Based Calculation – Uses swing points for accuracy.
✅ Multi-Timeframe Compatibility – Works on M1 to Monthly charts.
✅ Visual & Easy to Interpret – Clear red lines for quick analysis.
Indicator Settings & Parameters
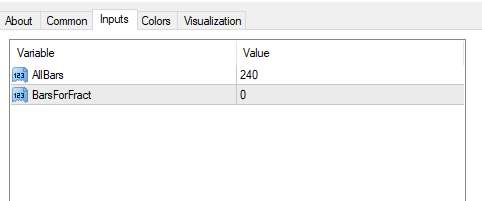
Input Parameters:
ParameterDescriptionDefault ValueRecommended Range
AllBarsNumber of bars analyzed240100-500 (higher = longer-term channels)
BarsForFractFractal sensitivity (0 = auto)00 (auto) or 10-50 (manual)
Visual Settings:
Upper/Lower Channel Lines: Red, solid, width=2
Middle Line: Red, dotted, width=1
Breakout Signals: Red arrows (when price breaches the channel)
How to Use the Flight Channels Indicator
1. Trend Identification
Uptrend: Price stays near the upper channel line.
Downtrend: Price stays near the lower channel line.
Range Market: Price oscillates between the upper and lower lines.
2. Trading Signals
Buy Signal: When price breaks above the upper channel (potential bullish continuation).
Sell Signal: When price breaks below the lower channel (potential bearish continuation).
Mean Reversion: Fade moves to the extreme edges of the channel (buy near lower line, sell near upper line).
3. Best Timeframes & Markets
Best for: Forex, Stocks, Commodities (trending markets).
Recommended Timeframes: H1, H4, D1 (for swing trading).
Slogan
"Fly High with Flight Channels – Navigate Trends Like a Pro!"
Pro Tips for Better Results
✅ Combine with Other Indicators:
Use RSI/MACD for divergence confirmation.
Add volume analysis to validate breakouts.
✅ Adjust Sensitivity:
For scalping, reduce AllBars (e.g., 100).
For long-term trends, increase AllBars (e.g., 500).
✅ Avoid False Breakouts:
Wait for candle closes outside the channel.
Check for support/resistance confluence.
Final Thoughts
The Flight Channels indicator is a powerful tool for traders who rely on price structure and trend channels. It works best in strong trending markets but may give false signals in choppy conditions.
🚀 Best for:
Swing traders looking for channel-based entries.
Breakout traders waiting for price to escape the channel.
Mean reversion traders fading extreme moves.
Would you like a modified version with alerts or multi-timeframe support? Let me know! 🎯