

×
![]()
Fractal Support and Resistance Indicator
Best MT4 indicator for defining fractal-based support and resistance. Identifies strong breakout trade setups. Ideal for forex intraday traders.
CATEGORIES: MT4, SIGNAL, LEVELS
Updated on: 03.11.2023
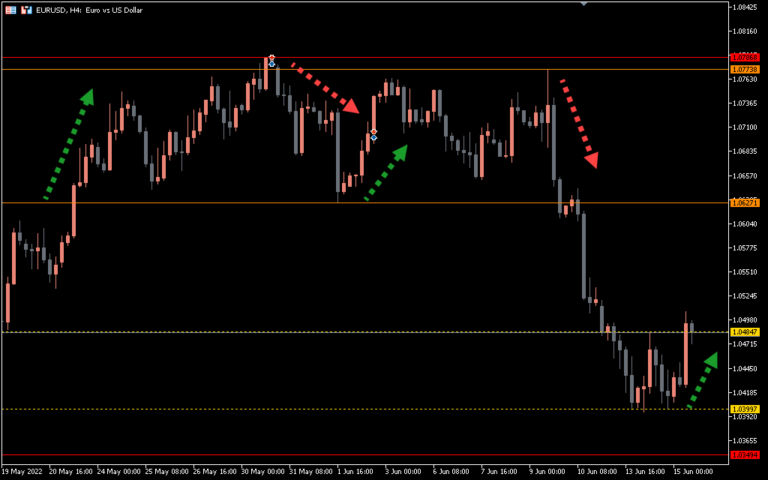
The Fractal Support and Resistance is a MetaTrader 4 based automatic horizontal support resistance indicator. The fractal line highlights strong support and resistance zone that guide forex intraday traders in defining swing and breakout trading opportunities.
This indicator is an alternative to pivot indicators. Pivot lines are plotted based on the day’s high, low, and close. On the other hand, fractal points are determined depending on the higher highs and lower lows of the price.
Generally, fractal indicator plots frequent arrows signaling for possible trend reversals. If you manually connect those fractal arrows with straight lines, you’ll find both horizontal and dynamic price channels. The specialty of fractal support and resistance is, it automatically connects the fractal points to plot horizontal price channels.
How to trade using the Fractal Support and Resistance MetaTrader indicator
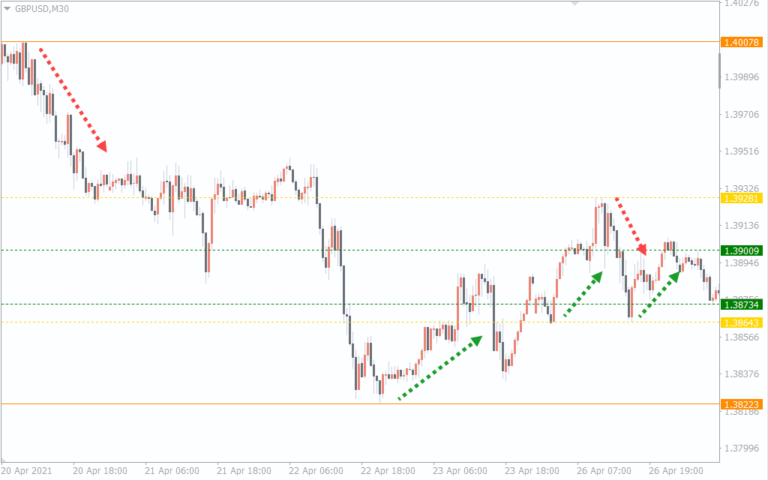
The above 30-minute GBPUSD chart shows how effective the auto fractal channels are in plotting strong support and resistance levels.
The dotted fractal lines represent the weekly S/R levels. On the other hand, the bold colored lines highlight the major intraday event areas of the market. As you can see in the above chart, the price mostly intends to roam inside the fractal channels. Since the horizontal levels of the channel reflect important event areas, the price often rebounds after hitting the S/R zone.
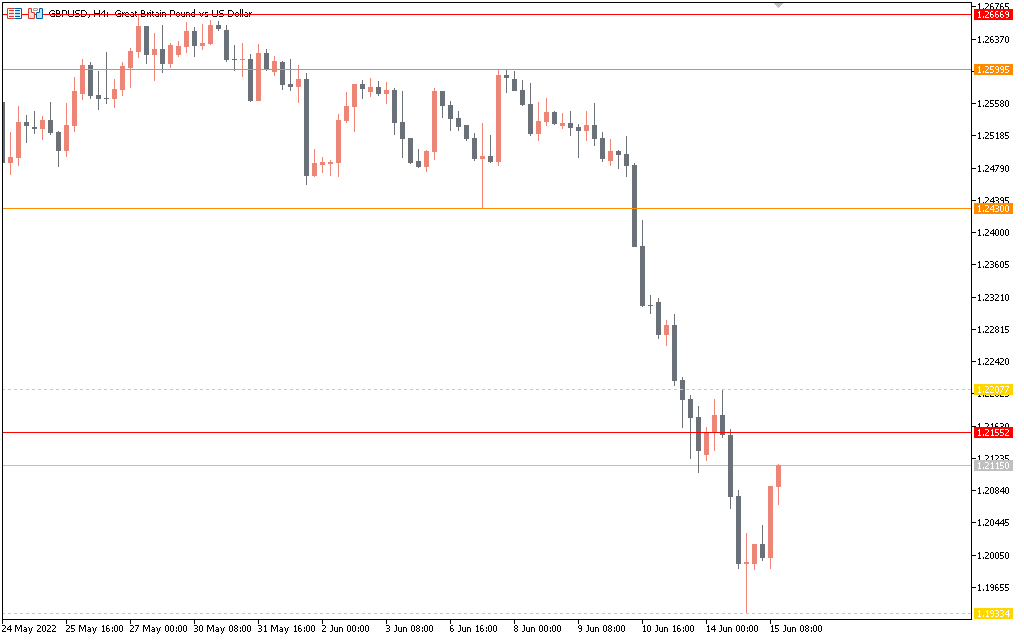
So, when you open an intraday chart, first check the positions of the fractal support and resistance lines. Second, observe the price positions compared to the fractal levels. For example, the price moving right below the fractal resistance means it’s time to look for a sell opportunity.
As you can see in the above example, each time the price plots a pin bar at the fractal lines; it rebounded and started to move in an opposite direction. So, during a ranging movement, we may aim for a buy order when a bullish pin bar is plotted at the fractal support. Oppositely, a bearish pin bar at the fractal resistance is an ideal sign to go short.