


×
![]()
FXSSI.StopLossClusters
The indicator displays levels on the chart with the maximum volume of Stop Losses set by other market participants.
Version
1.088
Platform
MT4MT5
First Release
Mar. 1, 2023
Last Update
Mar. 1, 2023
Category
Sentiment
Developed by
FXSSI team
Patch Notes
System Requirements
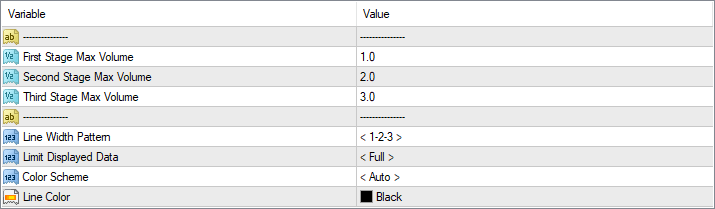
The numbers at the end of the chart indicate the volume of the cluster on the last candle.
Overview
How to use
How to Install
Reviews (58)
FXSSI.StopLossClusters
A beginner trader once thought:
“If only I knew where other traders set their Stop Losses, my trading performance would significantly improve.”
At the time, it was nothing more than a naive dream.
The trader couldn’t even imagine that today, we would have an opportunity of using such an indicator as FXSSI.StopLossClusters, in MT4 and MT5 terminals.
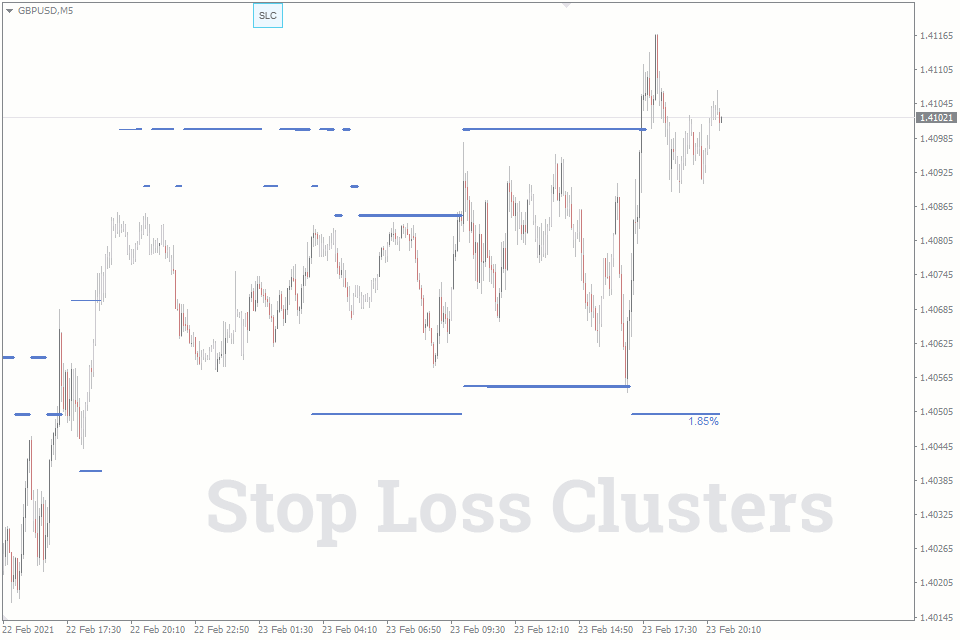
StopLossClusters Indicator
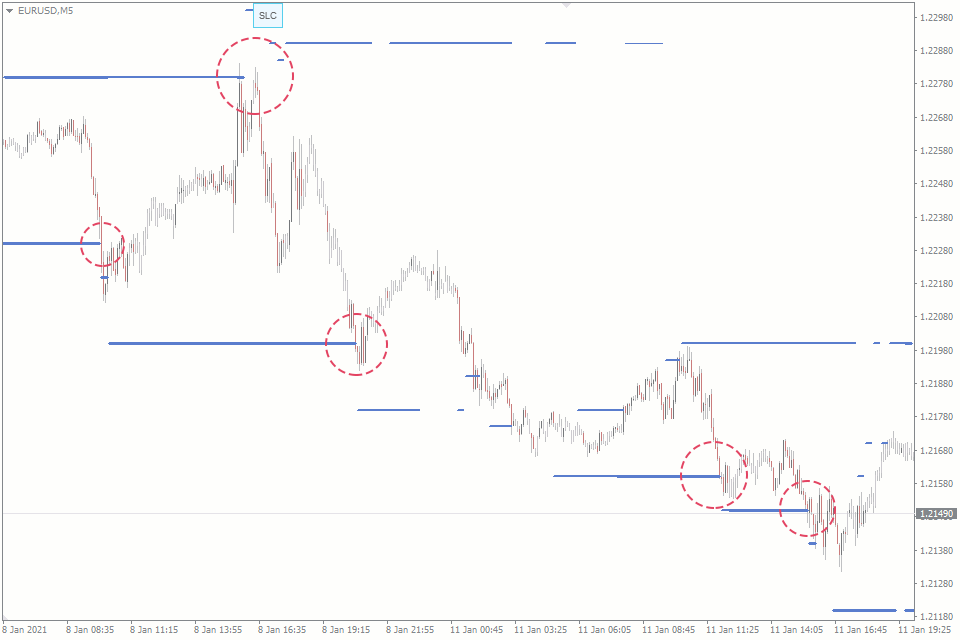
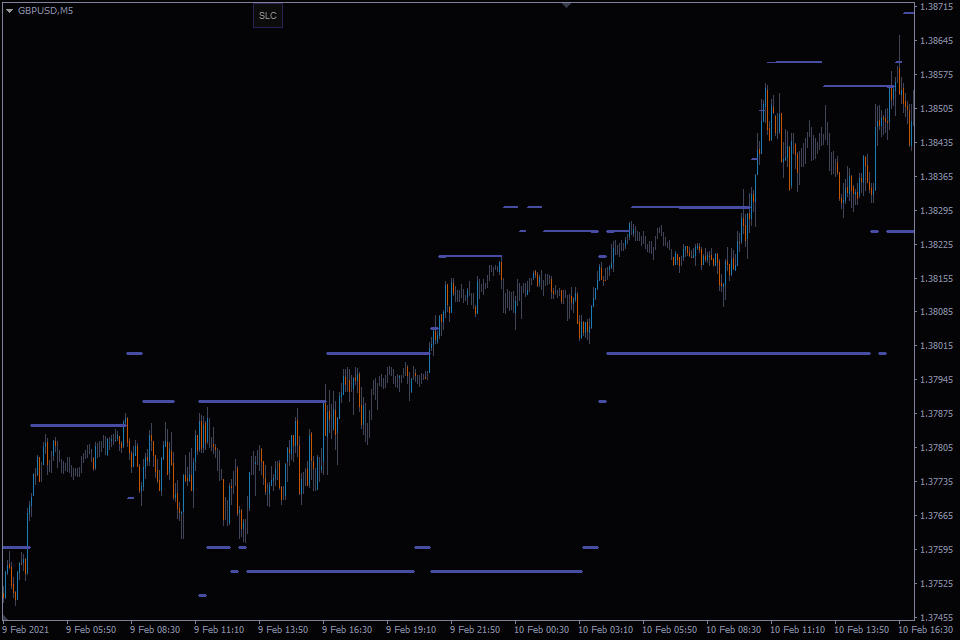
The Stop Loss Clusters (SLC) indicator shows where most market participants have placed Stop Losses for their trades. The largest accumulations of these orders – clusters – are displayed by the SLC indicator on the chart in the MT4/5 terminal.
Cluster (accumulation) implies a small range on the price scale of an asset, within which there is a significant number of Stop Losses set by other market participants.
Typically, the clusters form at local price lows and highs, or major support and resistance levels.
Out of all Stop Loss clusters, the SLC indicator displays only the two largest ones on the chart: one is above the current price, and the other is below it.
The larger the total cluster volume, the thicker will be the SLC indicator line displayed on the chart. By doing so, the indicator adds the third dimension (the cluster volume) to the chart, imitating a heat map.
Why it is important to know where Stop Losses of the market “crowd” are placed?
From the very beginning of their careers, every trader is always reminded of the importance of protective Stop orders. Indeed, trading without Stop Losses is considered very risky.
Following this recommendation, most traders set their Stop Losses using different approaches, and some of them even set Stop orders in a random place on the chart.
Despite the variety of Stop Loss setting techniques, eventually, their distribution will still be uneven. The reason is that traders are subject to the same behavioral tricks, also known as Psychological Traps.
The resulting clusters of Stop orders at specific price levels are a kind of the “fuel” for intensive price fluctuations.
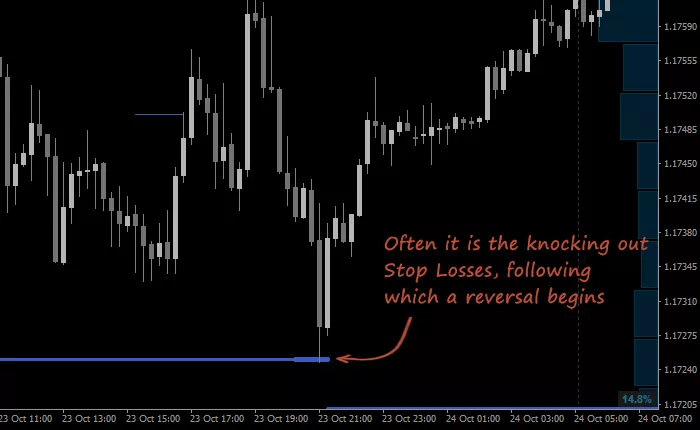
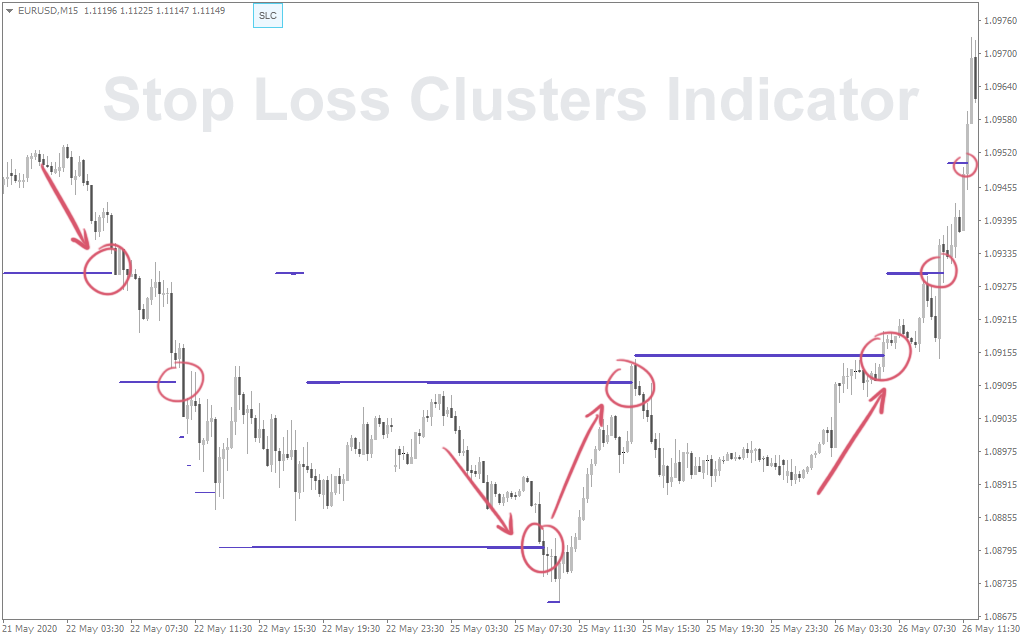
The following example shows how willingly the price interacts with large Stop Loss clusters:
Stop Loss sweet clusters
Sometimes it is hard to predict where the price will move after triggering a cluster. However, it is obvious that clusters pull the price towards them like a magnet.
With the information on Stop order clusters, you’ll be at least protected from the fact that your Stop Loss will trigger together with Stop Losses of the market crowd.
Speaking of the crowd, we’re not willing to offend anyone or divide traders into smart and not very smart ones. The “crowd” is nothing more than a convenient wording for describing the unprofitable traders prevailing in the market. That’s not our fault, that’s the nature of the market.
Trading With the SLC Indicator
The most valuable thing in the “Trading Against the Crowd” Strategy is knowing where Stop Losses of other market participants are placed.
With this information, a trader can artfully avoid dangerous areas when placing Stop orders or intentionally slip their Take Profit into the area of Stop Loss cluster.
The SLC indicator is not a stand-alone trading system but serves to achieve specific objectives.
This indicator is used to:
Determine the entry/exit points;
Set Take Profit;
Set Stop Loss properly;
To a lesser extent, define a trade direction.
Good entry and exit points
The following statement is true when speaking of good entry and exit points: You should sell where everyone buys and buy where everyone sells. Therefore, if the Stop Loss cluster is at the top, which actually implies Buy trades, we should sell at these levels. And we can do it in two ways:
By closing a previously opened Buy trade by Take Profit.
By opening a new Sell trade with the help of Limit order.
In both cases, a seller’s Stop Loss will act as counterparty to our Sell trade. The same is true for Buy trades: another buyer entering the market at more favorable prices will be the counterparty to buyers' Stop Losses.
The following picture shows an example of how a cluster of Stop Losses can be used as a pivot point when “buying” Stop Losses of buyers:
The two techniques described above are still slightly different from each other in the idea lying behind them. In the first case, we need liquidity to simply exit a trade with a profit, after which we don’t care where the price is going to move. In the second case, we open new trade and require the price to reverse and move downwards.
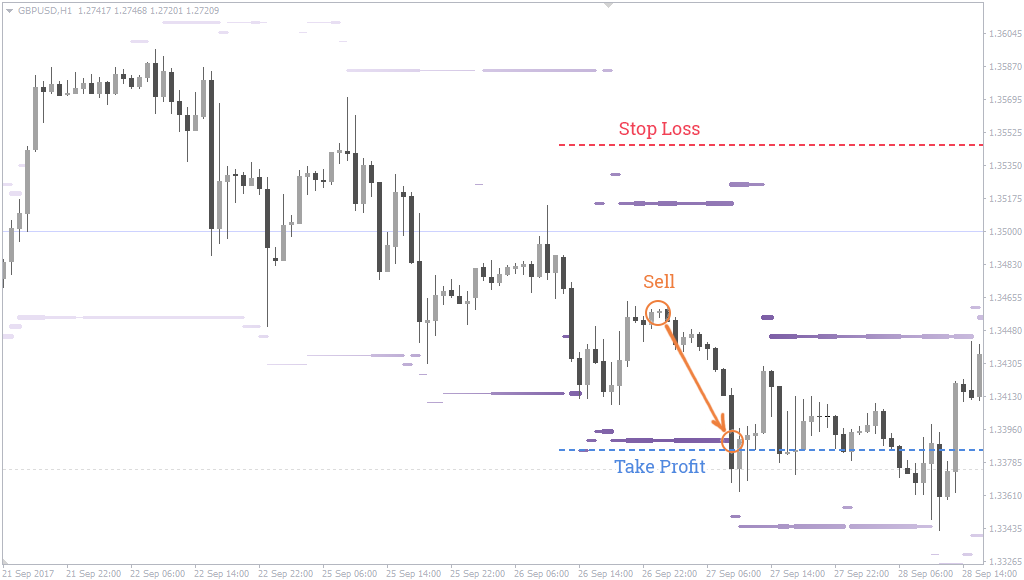
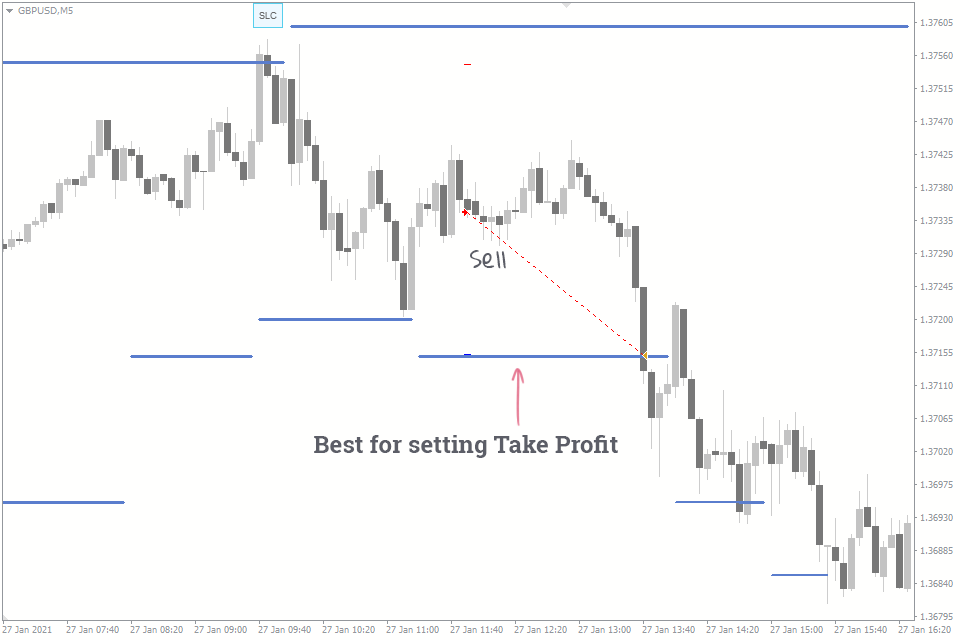
Setting Take Profit With the SLC Indicator
The SLC indicator is the best when it comes to setting Take Profit effectively.
The logic is quite simple: if you have an open trade, set Take Profit at the level of the Stop Loss cluster.
Stop Loss Clusters - trade parameters
The upper or lower cluster depends on trade direction: the lower is for Sell trades, and the higher one is for Buy trades.
Given that the price often triggers such Stop Loss clusters, you can expect an improvement in your trading performance.
In fact, your Take Profit might trigger both, from a target-oriented movement and pushing the price for “knocking out" Stop Losses. This increases the probability of a winning trade.
Read the article “How to Set Take Profit Properly?” for more information on this technique.
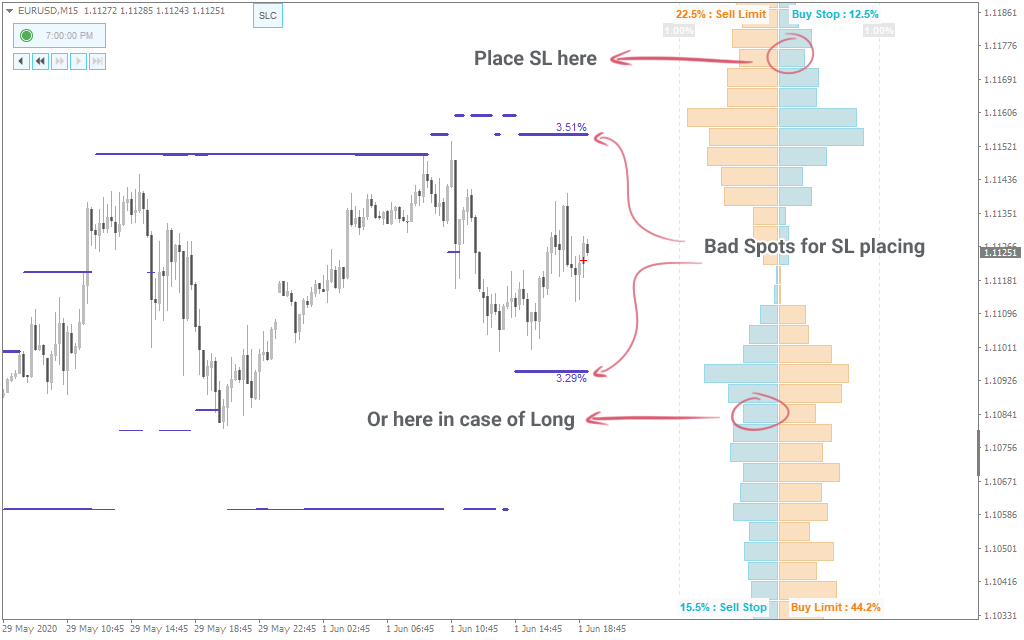
Setting Stop Loss With the SLC Indicator
If in the case of Take Profit, we recommend setting it at the level of the Stop Loss cluster, it makes sense that your Stop Loss should be placed somewhere else.
The logic behind it is as follows: Set your Stop Loss at the level with the fewest number of Stop Losses of other market participants. That way, you’ll reduce the probability of triggering your Stop Loss by a false price movement.
Spots to place stop loss
Using this strategy, consider the acceptable risk-to-profit ratio so that your Stop Loss is not set too far just because the fewer Stop Losses of other participants are placed there.
And yet, it’s better to set Stop Loss with the order book, since the SLC indicator doesn’t show the areas with a minimum number of Stop Losses.
Can I Determine the Movement Direction Using the SLC Indicator?
Given that the indicator always displays only two clusters, you’ll certainly have a question when using it:
Will the price move straight to the larger cluster, or will it go towards the smaller one first? In practice, both options are possible.
This is a difficult question to answer if you only have information on the size of clusters.
A Stop Loss cluster may be the basis for opening a trade if:
The second cluster is very far away from the first one: obviously outside the daily volatility area;
One of the clusters has just been triggered by the price, following which there was a pullback. In this case, you can open a trade towards the second cluster;
The second cluster is not tied to the extreme price level and is constantly shifting.
In other cases, it’s recommended to look for the reason to enter a trade using additional tools.
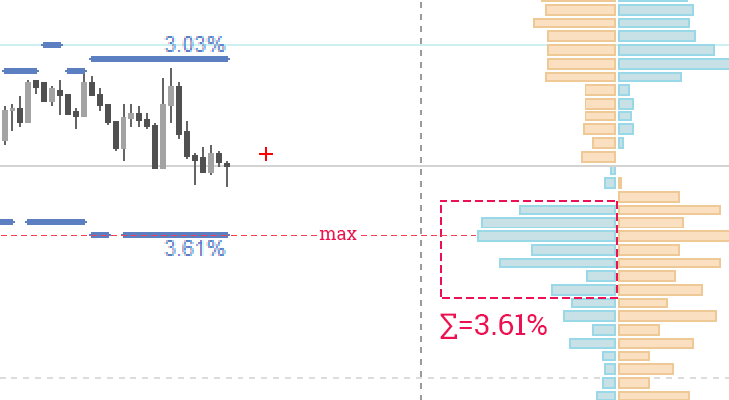
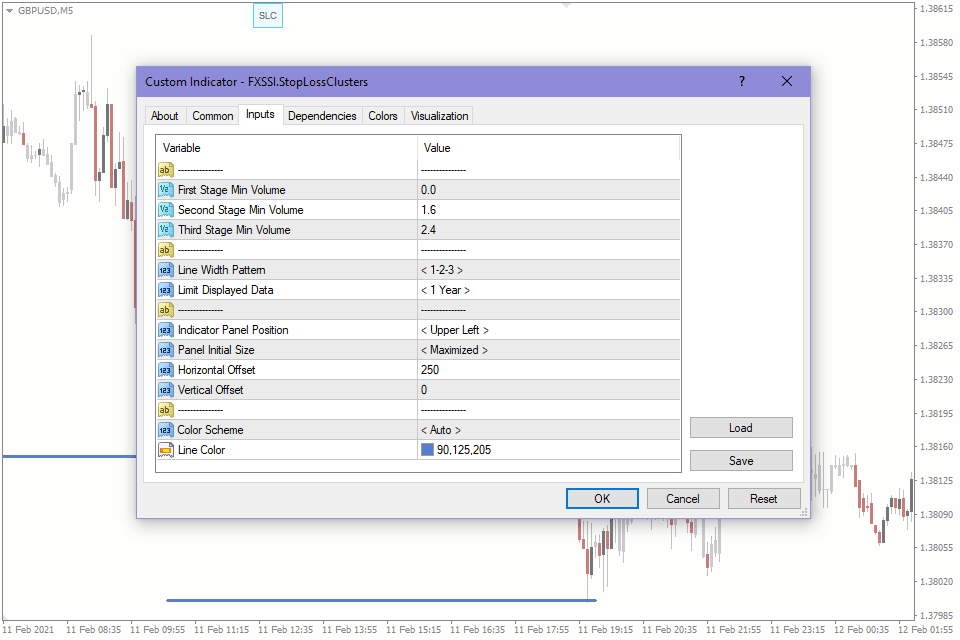
Anatomy of the Indicator
Data from the Order Book serve as a basis for this indicator. You can see two quadrants with blue histograms on its left side – they are Stop Losses placed by market participants.
To identify clusters, the algorithm will alternately search all the values of levels from the order book until it finds seven adjacent levels, the sum of which is maximum. The given sum is displayed on the chart. Of these seven levels, the level with the maximum trading volume is selected. It is used as a reference level for plotting the line of the StopLossClusters indicator on the chart.