


📈 Ghost Tracker Indicator — MetaTrader 4 (MT4)
Slogan:
🎯 "Track the Invisible, Trade the Inevitable."
🔍 What Is the Ghost Tracker Indicator?
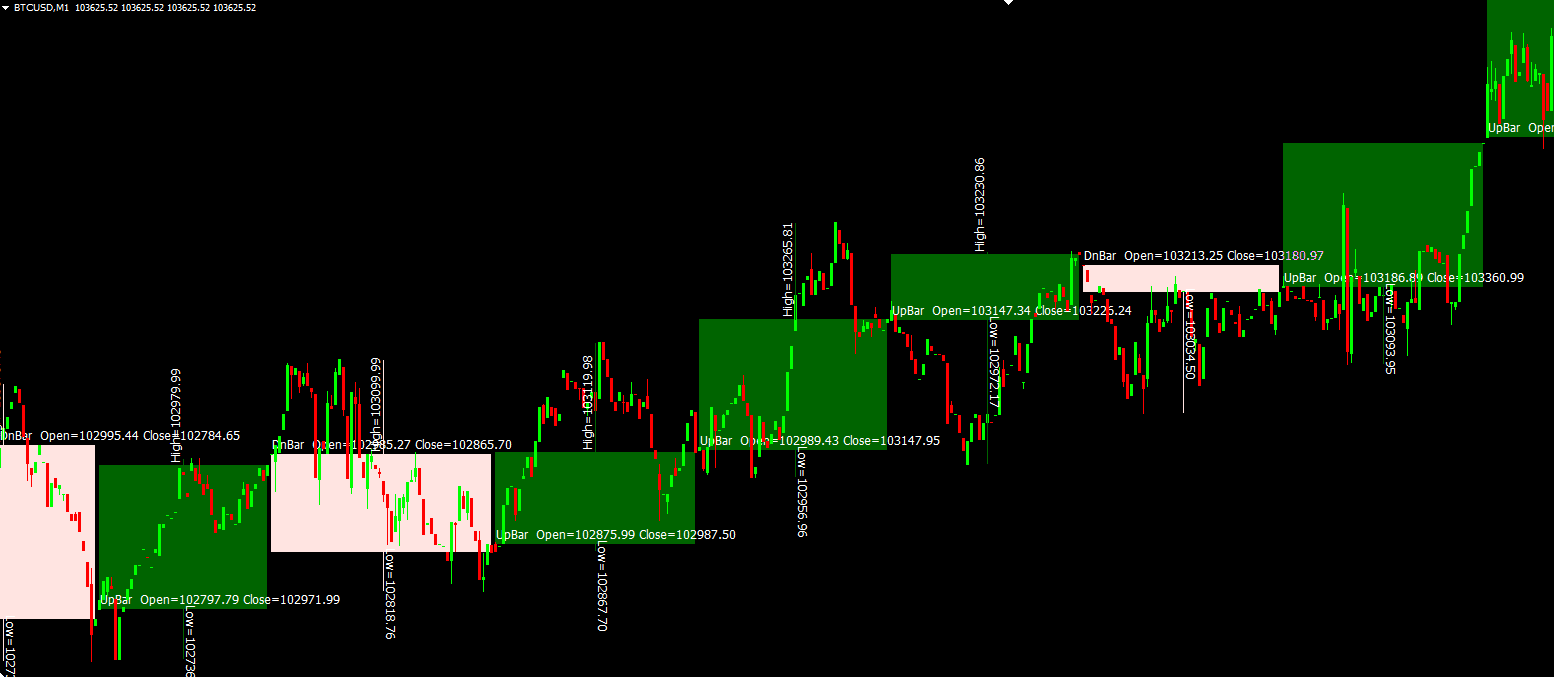
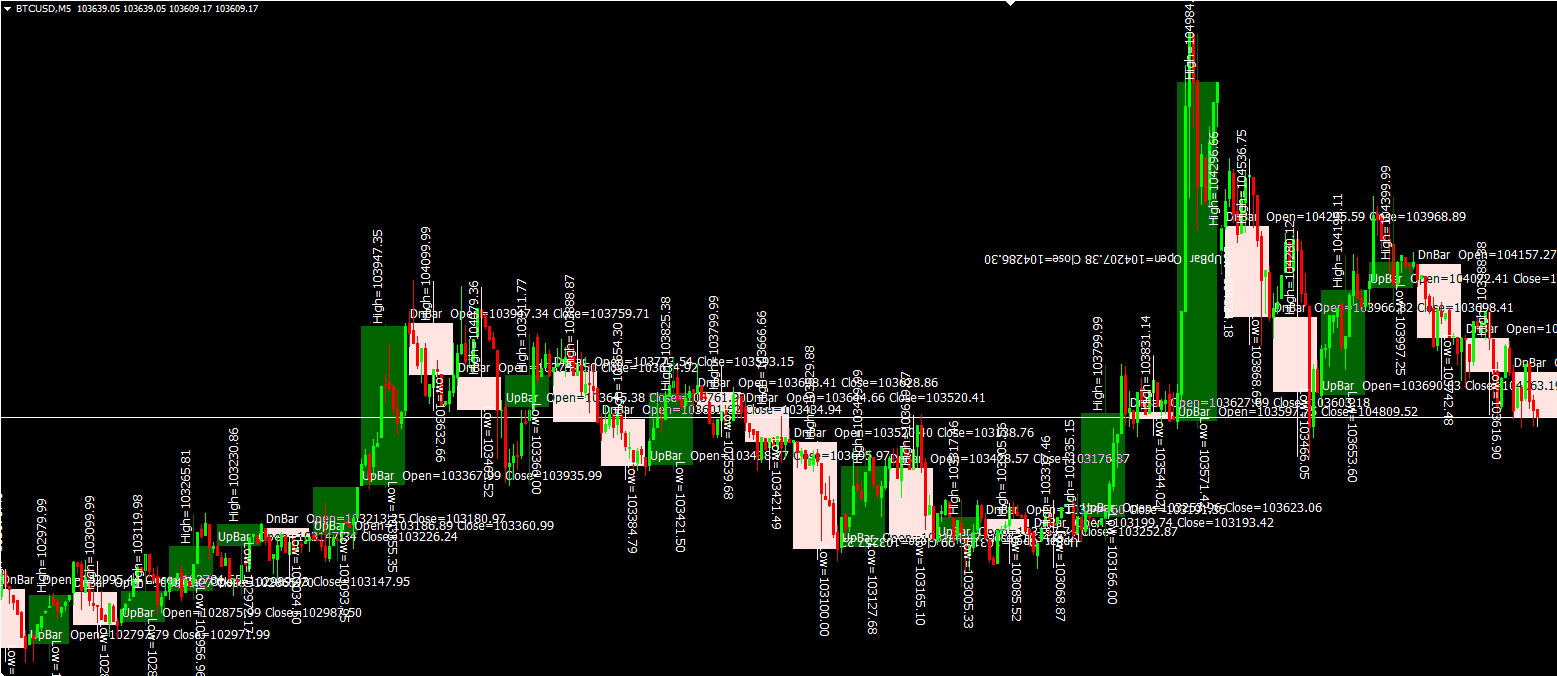
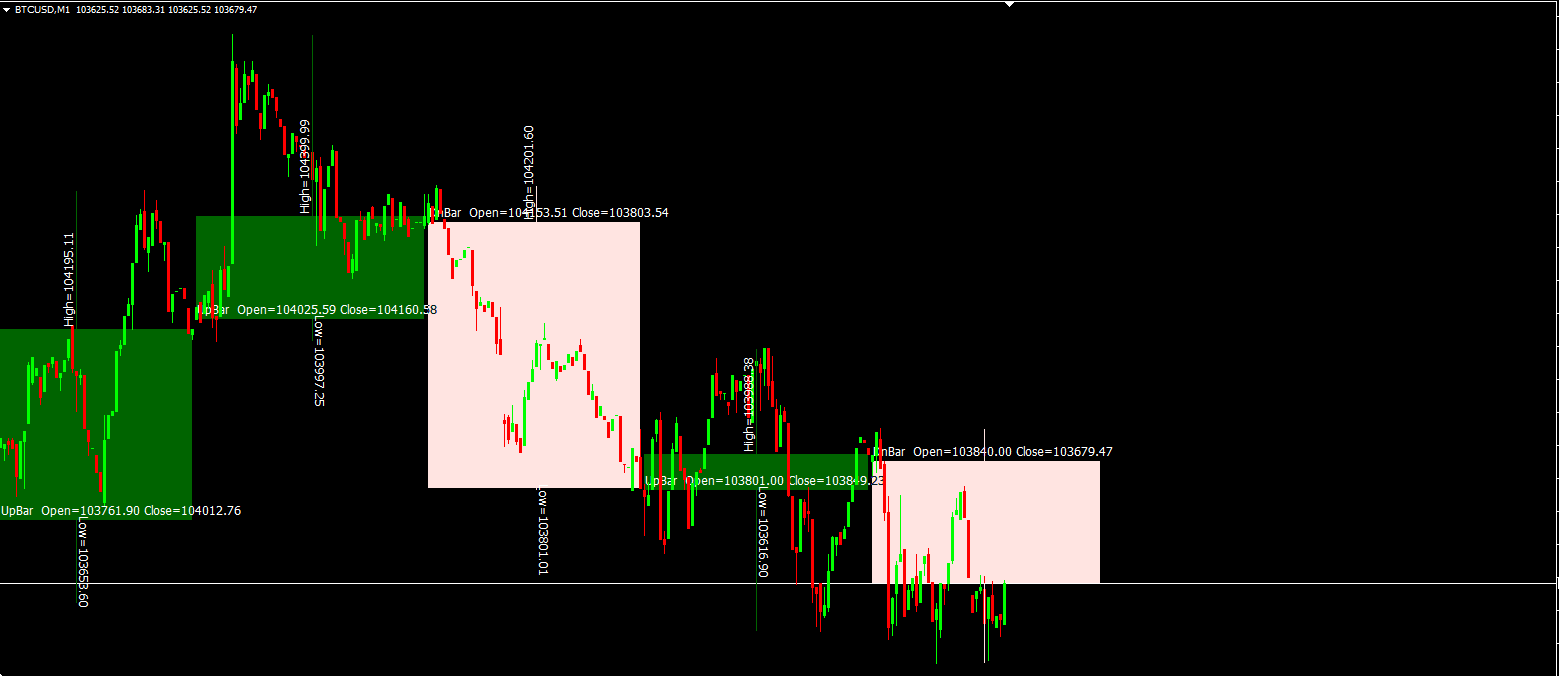
The Ghost Tracker is a custom multi-timeframe candlestick tracker designed for visualizing candle formations from higher timeframes directly on lower timeframe charts. This allows traders to see and interpret the structure, direction, and shadow details of higher timeframe candles (like daily candles) even when analyzing on smaller periods (like H1 or M15).
Its unique purpose is to help traders detect potential support/resistance zones, price action reversals, or continuation patterns by overlaying ghost candles (rectangles and lines) representing a higher timeframe’s OHLC data directly on your active chart.
🧠 Core Functionality:
Displays the open, high, low, close (OHLC) of a higher timeframe candle.
Tracks the candle's shadows/wicks and marks them with trend lines.
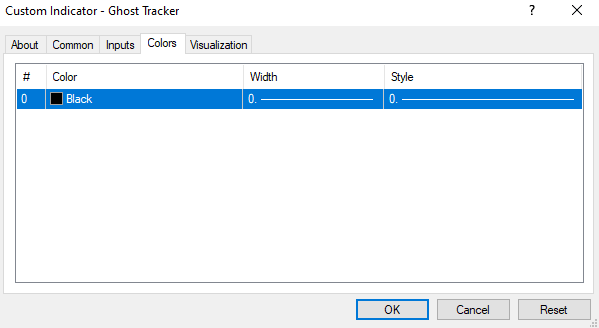
Color codes the candles based on type:
🟩 Up Candle
🟥 Down Candle
🟦 Doji
Automatically updates the candle as time progresses.
Uses server time and configurable session open times (like NY open at 14:00 server time).
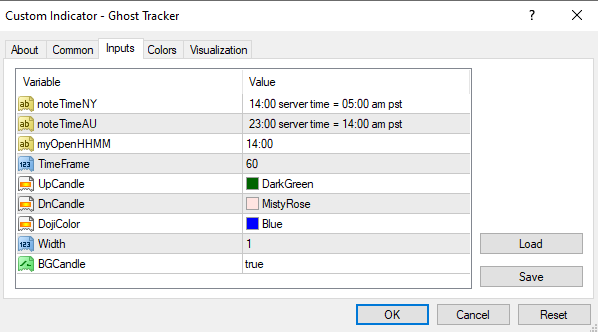
⚙️ Input Parameters:
ParameterDescription
noteTimeNYNY session open time (for your reference, not used programmatically).
noteTimeAUAU session open time (for your reference).
myOpenHHMMCustom daily open time in HH:MM format (e.g., 14:00 for NY session).
TimeFrameTimeframe for the ghost candles (e.g., 60 = H1, 1440 = D1).
UpCandleColor for bullish candles.
DnCandleColor for bearish candles.
DojiColorColor for doji candles.
WidthWidth of the candle outlines.
BGCandleWhether to fill the candle body or not.
🧭 How to Use the Ghost Tracker:
Apply the Indicator to Any Chart:
Recommended to use on lower timeframes (M5, M15, H1).
Set the TimeFrame Parameter:
For example, set to 1440 to display Daily candles on any intraday chart.
Customize the Session Time:
Set myOpenHHMM to match your broker's server time for sessions (e.g., 14:00 for New York Open).
Interpret the Visual Output:
Candles are drawn using rectangles (box from open to close).
Shadows/wicks are shown using lines above and below.
Use the candle formation to identify possible entry zones, breakouts, or pullbacks.
💡 Why Use Ghost Tracker?
Gain multi-timeframe insight at a glance.
Enhance price action analysis by viewing higher timeframe structures.
Improve timing of entries and exits on lower timeframes.
Avoid switching back and forth between chart windows.
🚫 Limitations:
The indicator does not support timeframes greater than Daily (1440).
Will not run on charts where Period() 240 (i.e., H4 or higher).
Ensure your session time (myOpenHHMM) is correctly aligned with your broker's server time.
✅ Best Use Case Examples:
Scalpers and intraday traders viewing daily structure while trading on M15.
Swing traders looking for confirmation of candle strength across timeframes.
Manual price action traders aligning higher timeframe candles with support/resistance or Fibonacci zones.