
Indicator Name: Brooky PSAR Levels MTF TT
(Parabolic SAR Support & Resistance with Multi-Timeframe View)
🧠 What is this Indicator?
Brooky PSAR Levels MTF TT is a custom MetaTrader 4 indicator that combines the Parabolic SAR (Stop and Reverse) trend-following mechanism with visual support and resistance level plotting across multiple timeframes.
It detects trend reversals and projects horizontal levels at key Parabolic SAR flip points. These levels can act as support (for buys) or resistance (for sells). The indicator also includes real-time alerts and customizable drawing tools, making it a strong tool for technical traders.
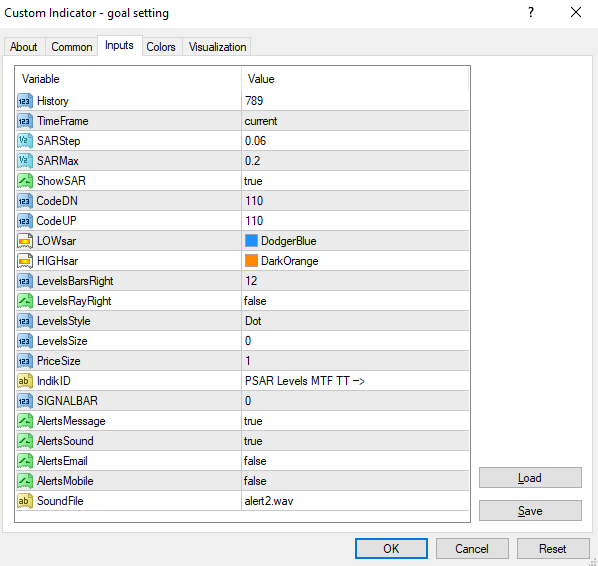
⚙️ Settings Explained
InputDescription
HistoryNumber of past bars to process/analyze.
TimeFrameSelect the timeframe for SAR calculation (e.g. H1, H4, etc.).
SARStepStep value for Parabolic SAR (sensitivity setting).
SARMaxMaximum value for SAR acceleration.
ShowSARToggle SAR drawing ON/OFF.
CodeDN / CodeUPArrow code (symbol code) for SAR down/up signals.
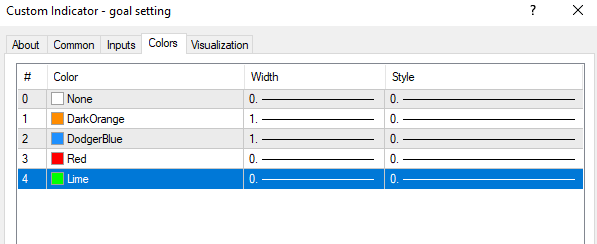
LOWsar / HIGHsarColor for support and resistance lines.
LevelsBarsRightHow far right (into the future) to draw the level lines.
LevelsRayRightWhether level lines extend infinitely to the right.
LevelsStyleLine style for levels (e.g., dotted, solid).
LevelsSize / PriceSizeThickness of the level lines and price arrows.
IndikIDCustom prefix for object naming (for easy management of chart elements).
SIGNALBAROn which bar the signal/alert should trigger (usually 0 = current bar).
AlertsMessageShow alert messages in MetaTrader terminal.
AlertsSoundPlay a sound when signal occurs.
AlertsEmailSend an email alert.
AlertsMobileSend a push notification to your mobile.
SoundFileSound file to play on alert (e.g. "alert2.wav").
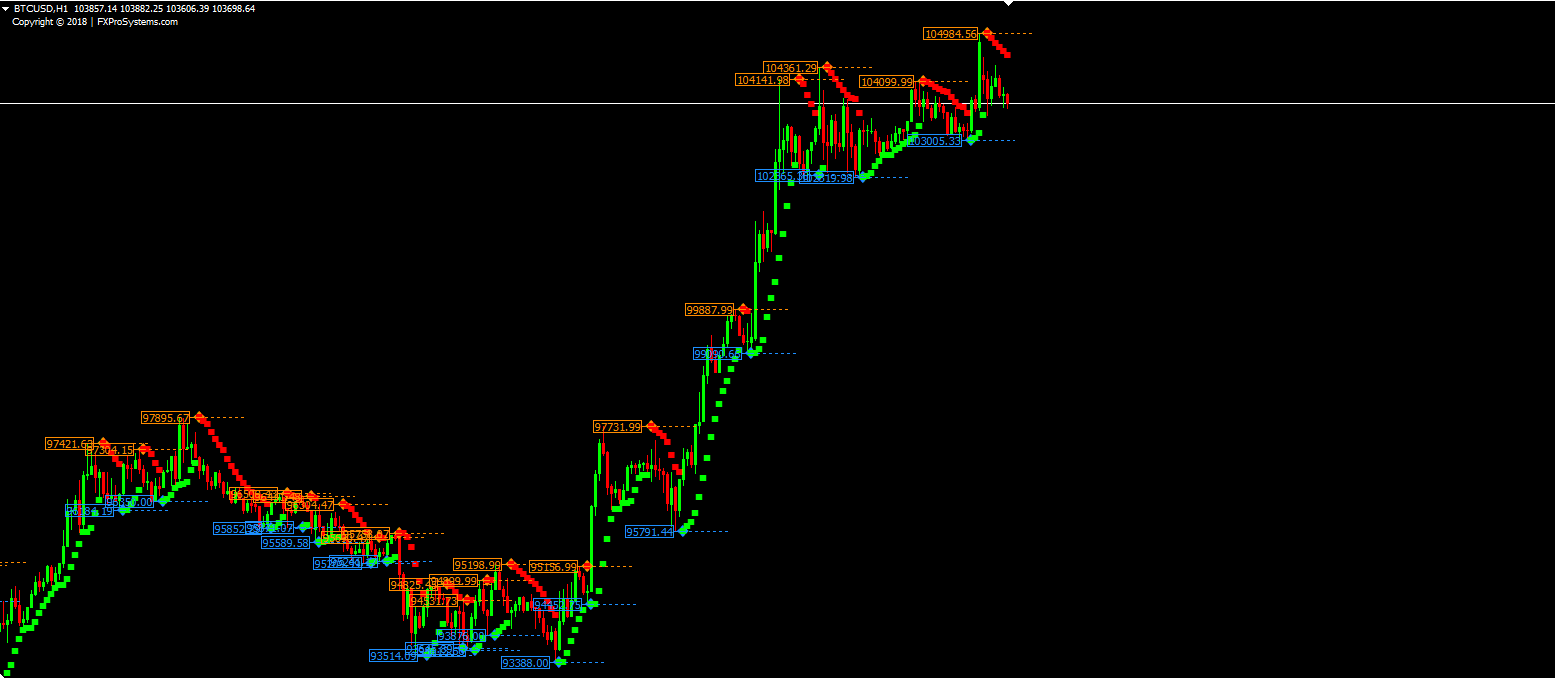
📈 How to Use This Indicator
Trend Identification:
When SAR flips from below price to above price, a potential sell (resistance) signal is triggered. When it flips from above to below, a buy (support) level is indicated.
Support & Resistance Drawing:
Automatically draws horizontal trend lines at these SAR reversal points, helping visualize critical areas.
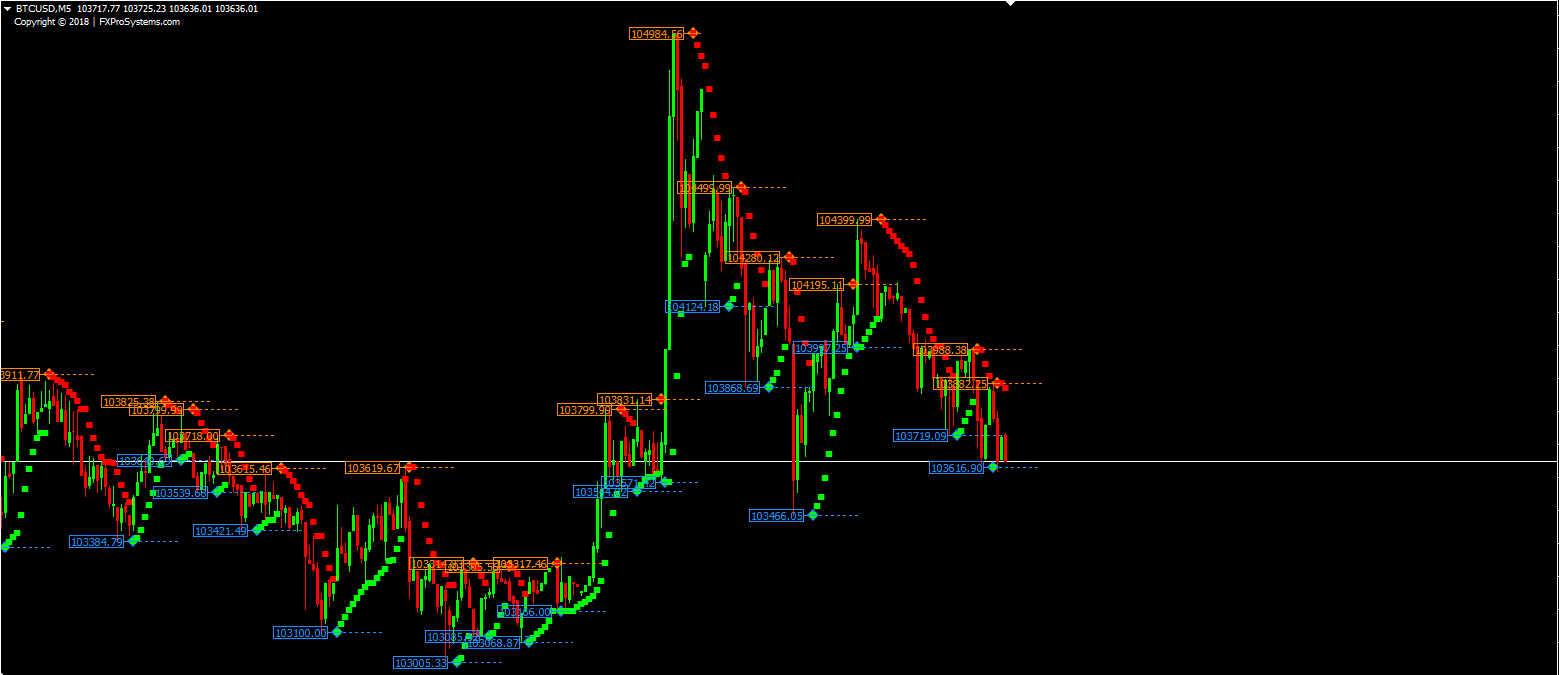
Multi-Timeframe Advantage:
You can apply SAR values from higher timeframes (e.g. H4) on lower charts (e.g. M15), helping avoid noise and focus on stronger trends.
Alert System:
Set up alerts for when new SAR flips occur — useful for entry signals or confirming market direction.
Custom Chart Markings:
Arrows and lines are placed on the chart with identifiers, making it easy to trace the source of signals.
🧪 Best Practices & Tips
Use this indicator in conjunction with price action or other indicators (like RSI or MACD) for confirmation.
Apply it to higher timeframes (H1, H4, D1) for swing trading, or lower timeframes (M5–M30) for scalping.
Adjust the SARStep and SARMax to make the SAR more/less sensitive depending on market volatility.
Turn off ShowSAR if you want only the level lines without SAR dots.
💬 Suggested Slogan
“Brooky PSAR Levels – Where Trend Flips Become Trade Setups.”
Or a more assertive one:
“Brooky PSAR MTF — See the Flip. Trade the Edge.”