
Golden MA TT Indicator – Comprehensive Explanation
This indicator is an advanced technical analysis tool for MT4, designed to identify key supportresistance levels, buysell zones, and reversal signals based on yesterday’s price action.
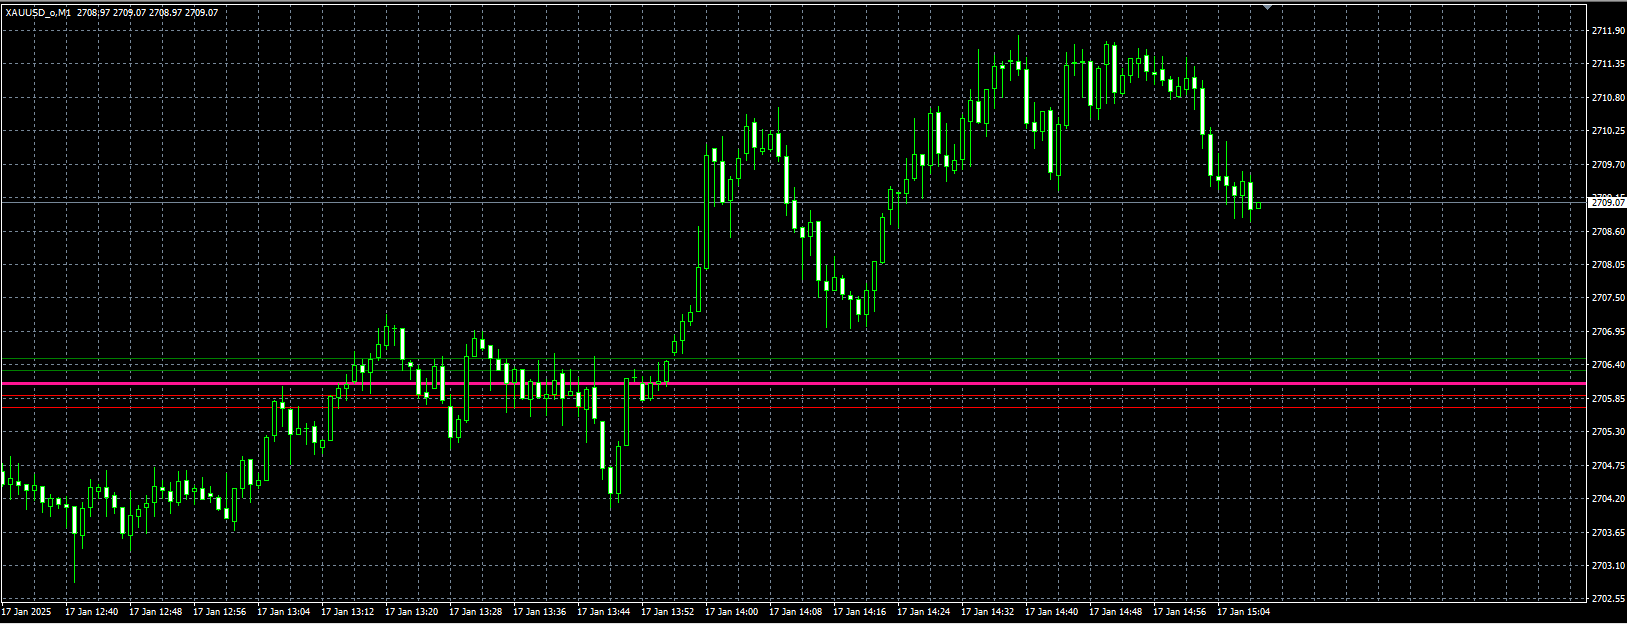
🔵 How Key Levels Are Calculated
1. Central Line (MID) Calculation
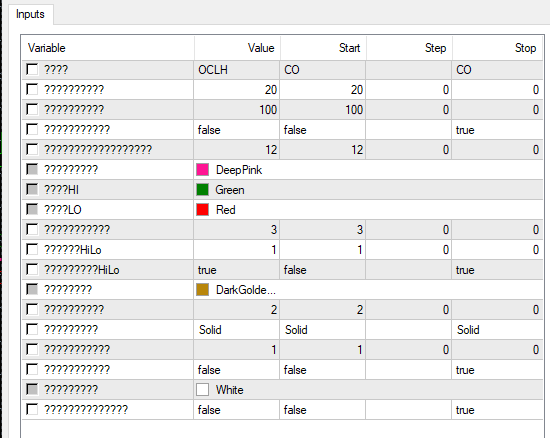
The indicator uses 5 different methods (selectable in settings) to calculate the midline
CO Average of Close + Open
OCLH Average of Open, Close, Low, High
MEDIAN (High + Low)2
TYPICAL (High + Low + Close)3
WEIGHTED (High + Low + 2×Close)4
2. High (HI) & Low (LO) Levels
Supportresistance levels are derived from pip-based distances from MID
HI Levels (Resistance)
HI1 = MID + (StartPips × Pip)
HI2 = MID + (2 × StartPips × Pip)
HI3 = HI1 + (MID − Low − 5 pips) → Potential reversal zone
HI4 = MID + (High − Low + 5 pips) → Overbought warning
HI5 = 2×MID + (High − 2×Low + 5 pips) → Danger! Stop buying!
LO Levels (Support)
LO1 = MID − (StartPips × Pip)
LO2 = MID − (2 × StartPips × Pip)
LO3 = LO1 + (MID − High + 5 pips) → Potential reversal zone
LO4 = MID − (High − Low − 5 pips) → Oversold warning
LO5 = 2×MID − (2×High − Low − 5 pips) → Danger! Stop selling!
🔴 Practical Applications
1. BuySell Zones
Buy Zone Between LO1 and LO2 (start of selling pressure).
Sell Zone Between HI1 and HI2 (start of buying pressure).
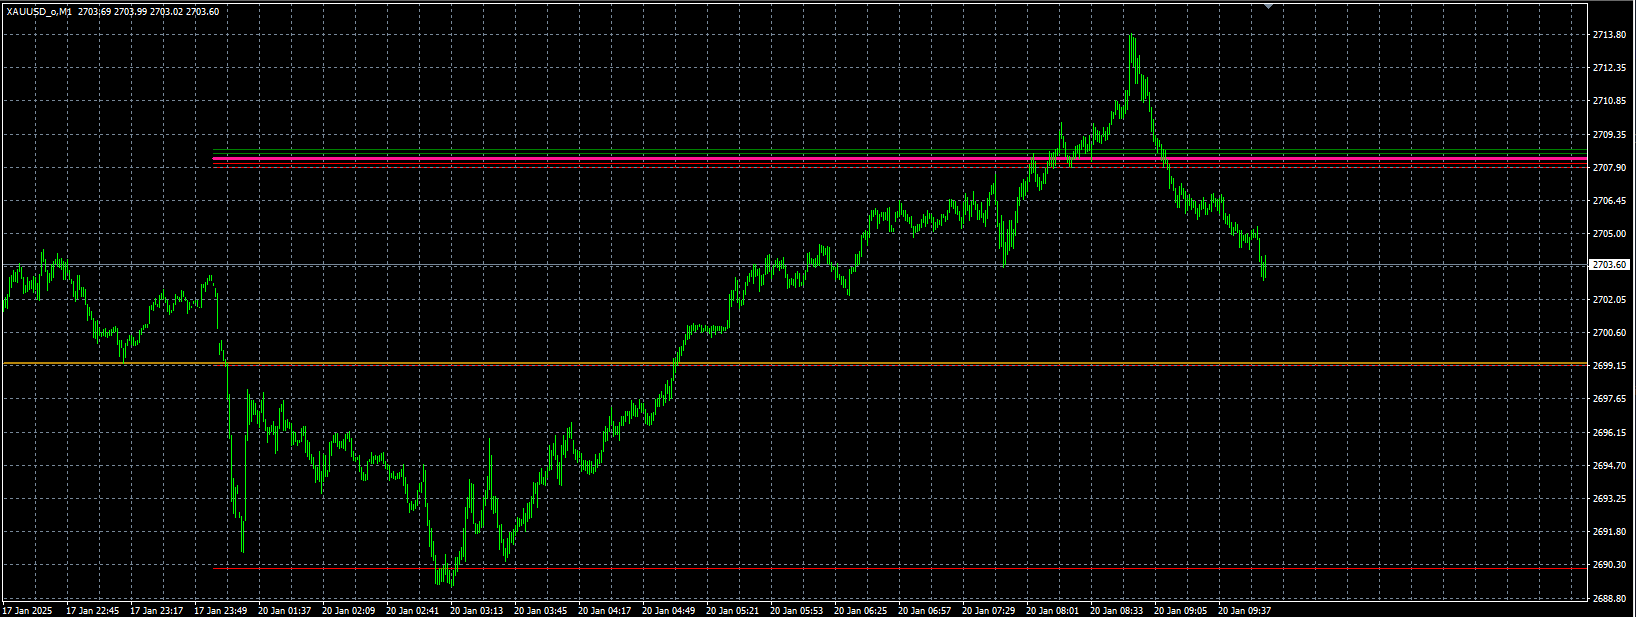
Reversals
HI3LO3 → Possible trend reversal points.
HI4HI5 & LO4LO5 → Extreme overboughtoversold alerts.
2. Yesterday’s HighLow
If ВчерашнийHiLo = true, yesterday’s HighLow are plotted as horizontal lines.
3. Internal Helper Lines
If ВнутрПипсы 0, additional mid-range lines (between MID and HILO) are displayed.
4. Customizable Features
Colorsline thickness Adjustable per level.
Text labels Enabled if ТекстРазмер 4.
Timeframe Uses daily (D1) data but works on all timeframes.
📌 Execution Tips
✅ Best Pairs Major forex pairs (e.g., EURUSD, GBPUSD).
✅ Optimal Trading Time LondonNY sessions (highest reactivity).
✅ Limitation May generate noise on lower timeframes (e.g., M5M15).
🎯 Conclusion
This multipurpose tool is ideal for swing and position traders because it
✔️ Identifies dynamic supportresistance.
✔️ Flags overboughtoversold conditions.
✔️ Highlights potential reversal points.