
Golden Fibo Indicator - Comprehensive Guide
🏆 Motto:
"Trade with the Golden Ratio – Let Fibonacci Illuminate Your Path to Precision Profits!"
📌 Overview
The Golden Fibo indicator is a MetaTrader 4 (MT4) tool that automatically plots Fibonacci retracement levels and trading zones based on recent price extremes. Developed by R.KH 1001 and available on RoboMQL, this indicator helps traders identify key support/resistance levels and potential reversal zones using Fibonacci ratios.
🔧 How It Works
The indicator:
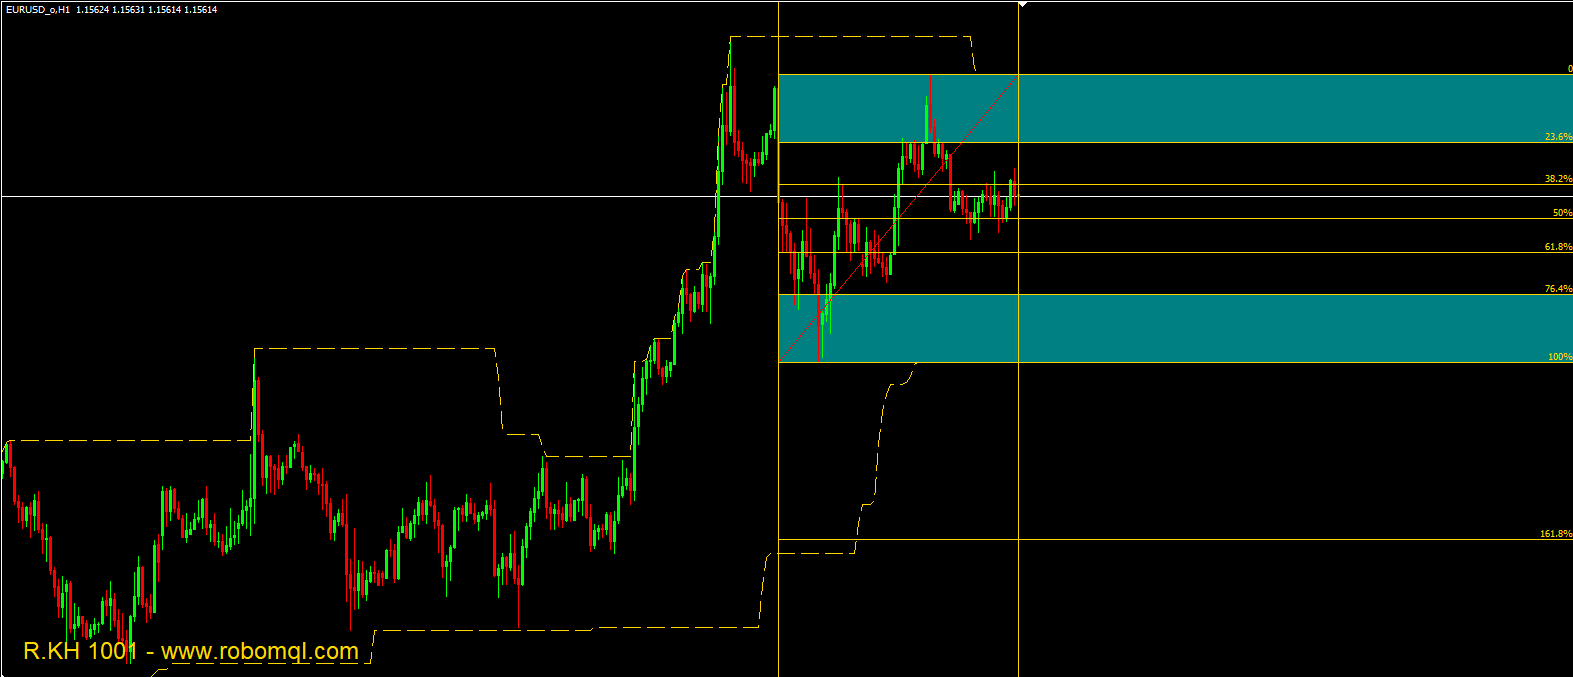
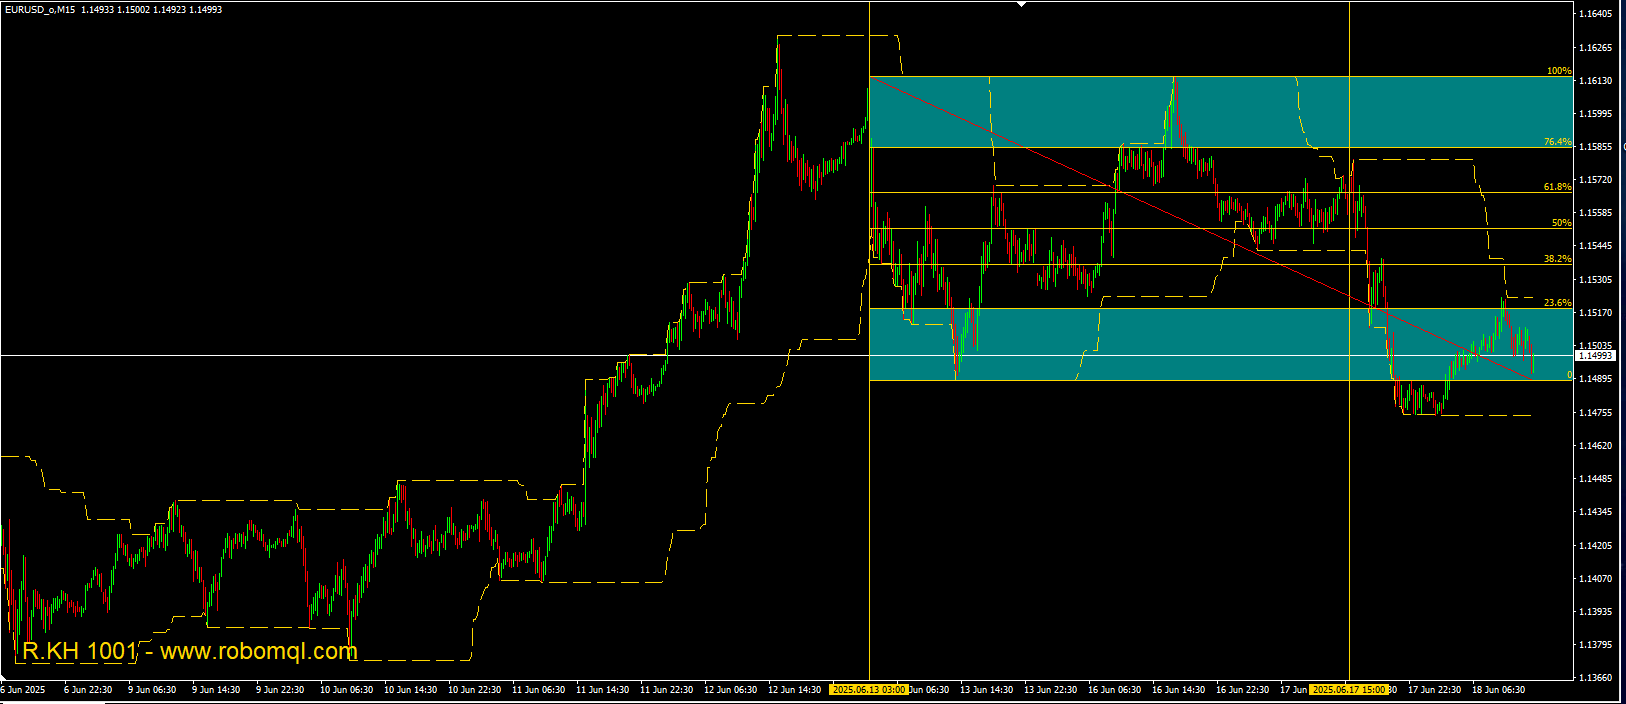
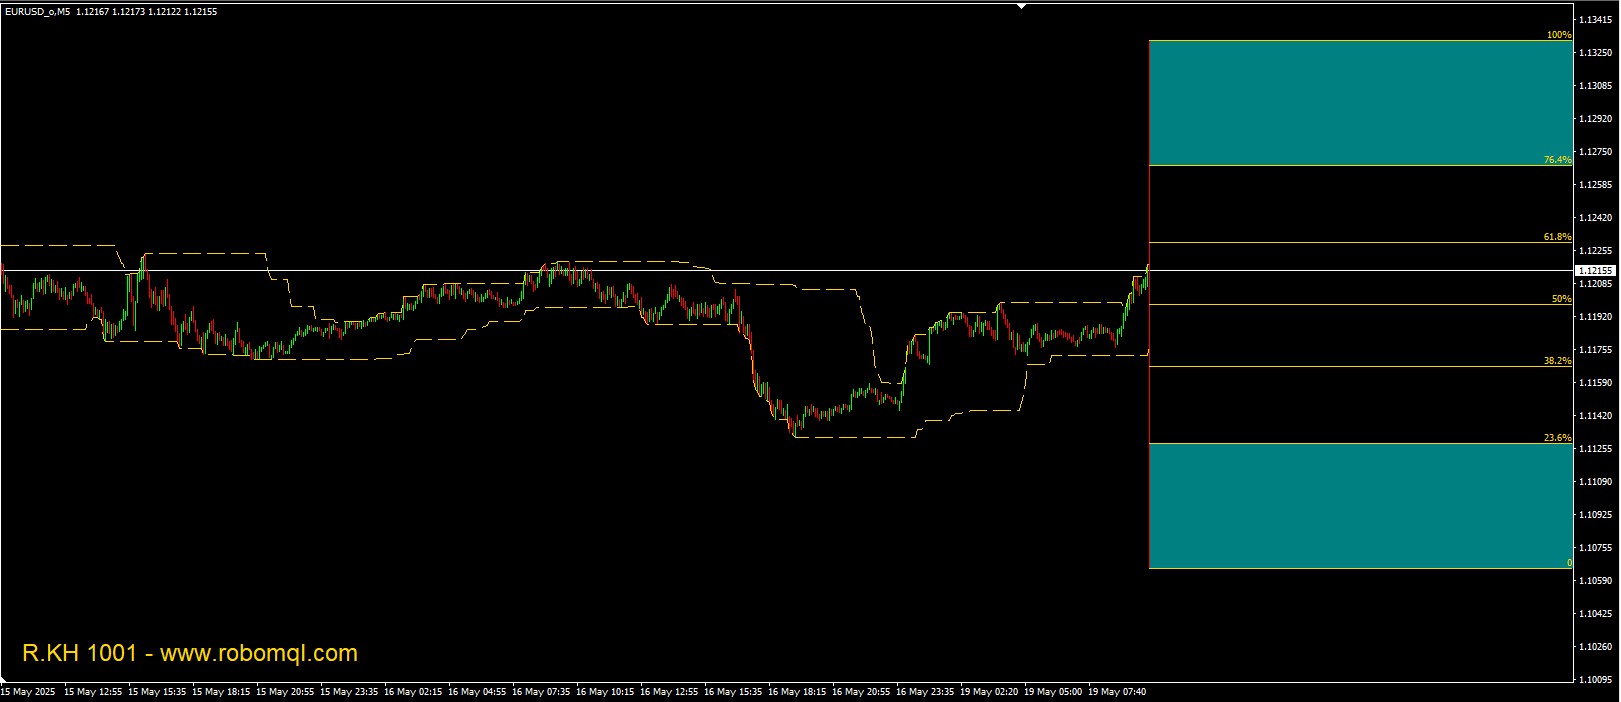
Automatically Detects Highs & Lows – Identifies the highest high and lowest low over a user-defined period.
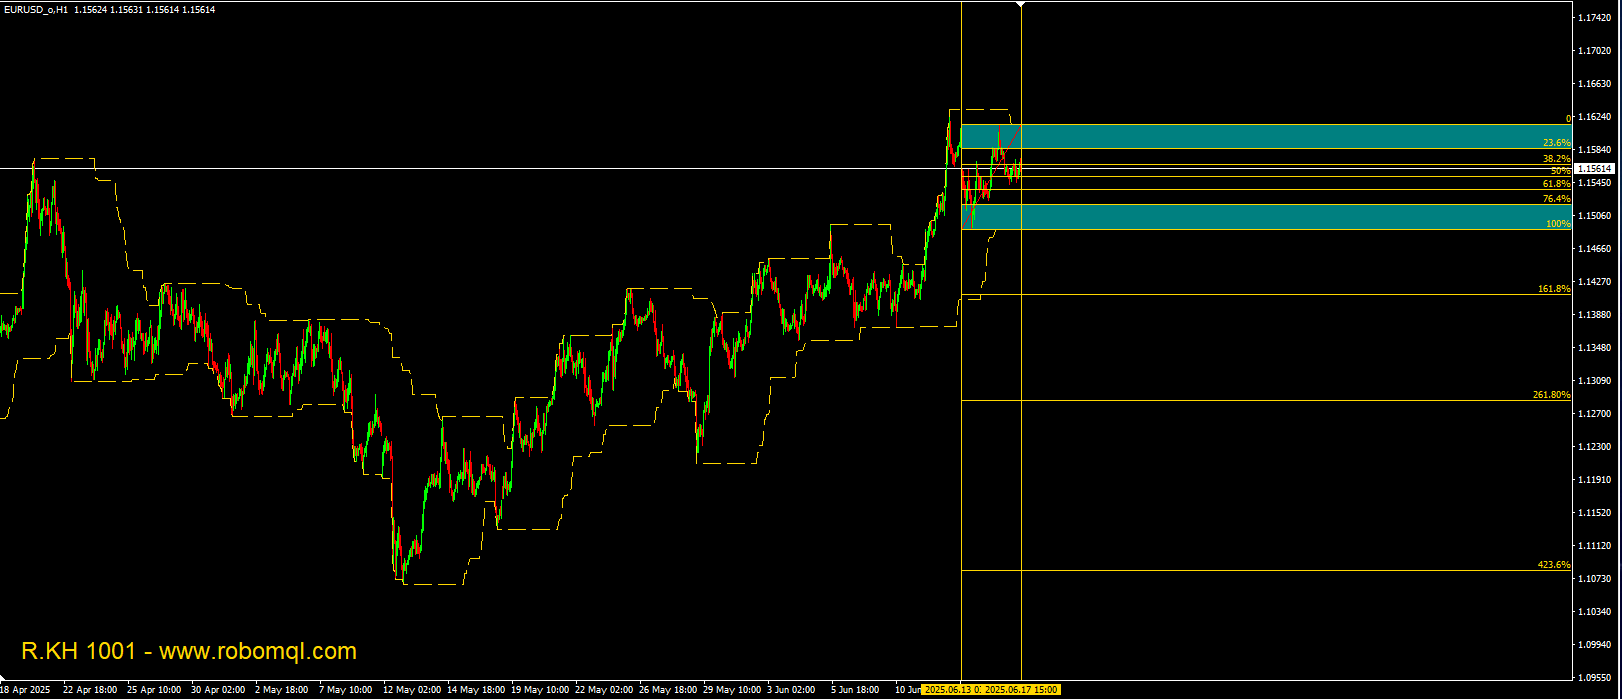
Plots Fibonacci Levels – Draws standard retracement levels (23.6%, 38.2%, 50%, 61.8%, etc.).
Highlights Trading Zones – Marks "Buy Zone" (near support) and "Sell Zone" (near resistance) for potential entries.
Dynamic Updates – Adjusts levels as new price data forms.
⚙️ Indicator Settings
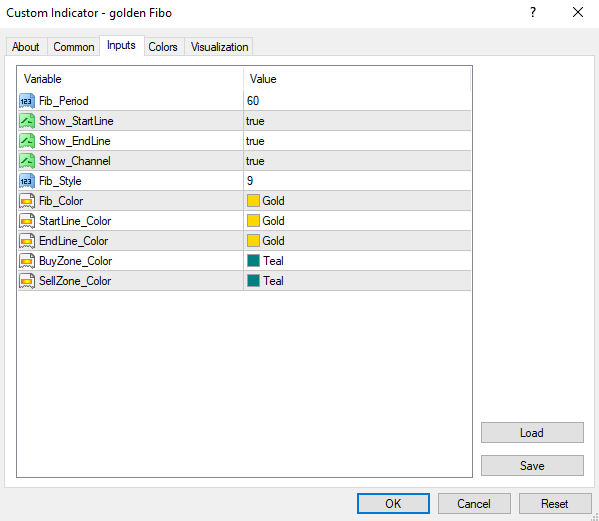
Input Parameters:
Fib_Period (Default: 60) – Number of bars used to calculate highs/lows.
Show_StartLine/Show_EndLine (Default: true) – Toggles vertical markers for the Fibonacci range.
Show_Channel (Default: true) – Displays high/low price channels.
Fib_Style (Default: 9 [DASH]) – Line style for Fibonacci levels.
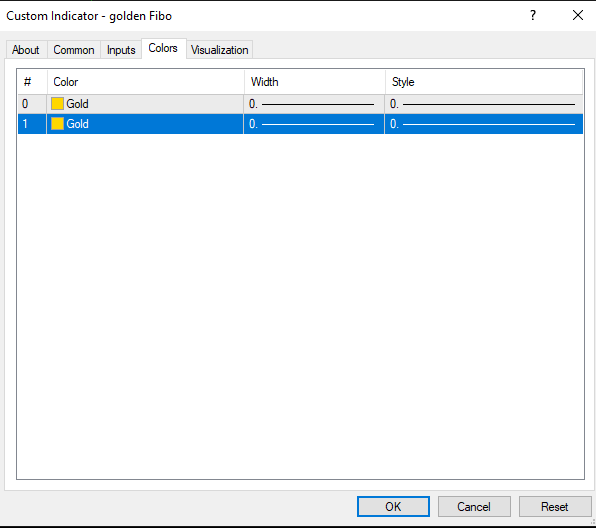
Color Customization – Adjust colors for Fibonacci lines, start/end markers, and trading zones.
Key Features:
Auto-Fibonacci Retracement – No manual drawing required.
Buy/Sell Zones – Highlights key areas for potential trades.
Flexible Timeframe Compatibility – Works on all chart timeframes.
🎨 Customization
Fibonacci Colors – Change via Fib_Color (default: gold).
Zone Colors – Modify BuyZone_Color (teal) and SellZone_Color (teal).
Line Styles – Adjust Fib_Style for dotted/dashed/solid lines.
📊 Practical Use Cases
Trend Retracements – Enter trades near Fibonacci support/resistance levels.
Breakout Confirmation – Price exiting the "Buy/Sell Zone" may signal trend continuation.
Risk Management – Use Fibonacci levels for stop-loss and take-profit placement.
🚀 Execution Logic
Calculates Extremes – Finds the highest high and lowest low over Fib_Period.
Draws Fibonacci Levels – Plots retracements between the detected extremes.
Updates Dynamically – Adjusts levels as new price data forms.
📌 Notes
Best used in trending markets (Fibonacci works poorly in choppy conditions).
Combine with RSI/MACD for confirmation.
Avoid trading solely on Fibonacci levels—wait for price action confirmation.
👨💻 Developer & Source
Developer: R.KH 1001
Website: RoboMQL
🌟 Final Words
The Golden Fibo indicator is a powerful tool for traders who rely on Fibonacci-based strategies. With automated levels and clear trading zones, it simplifies decision-making while maintaining flexibility for customization.
Trade Smart, Follow the Golden Ratio! 🌟