
Hidden Power Indicator - Complete Explanation
Overview
The Hidden Power indicator is a sophisticated multi-timeframe trend and volatility analysis tool that combines:
Bollinger Bands (volatility measurement)
Keltner Channels (trend identification)
Linear Regression Slope (momentum detection)
Squeeze Detection (volatility contraction/expansion)
It helps traders identify:
Trend direction (bullish/bearish)
Momentum strength (via histogram colors)
Volatility squeeze conditions (potential breakout signals)
Key Components
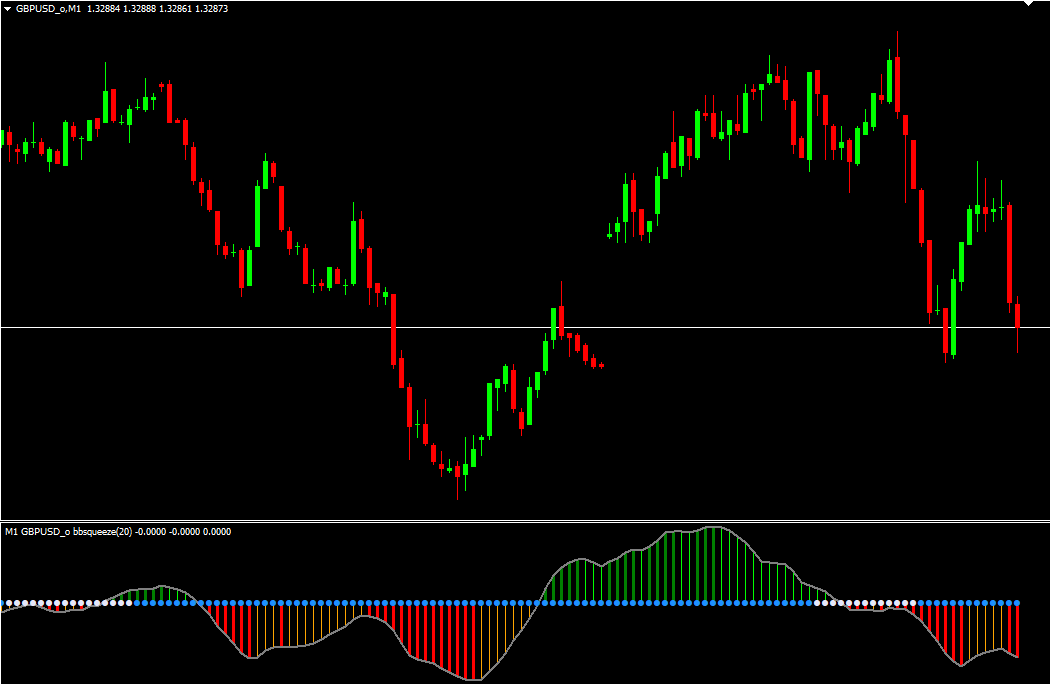
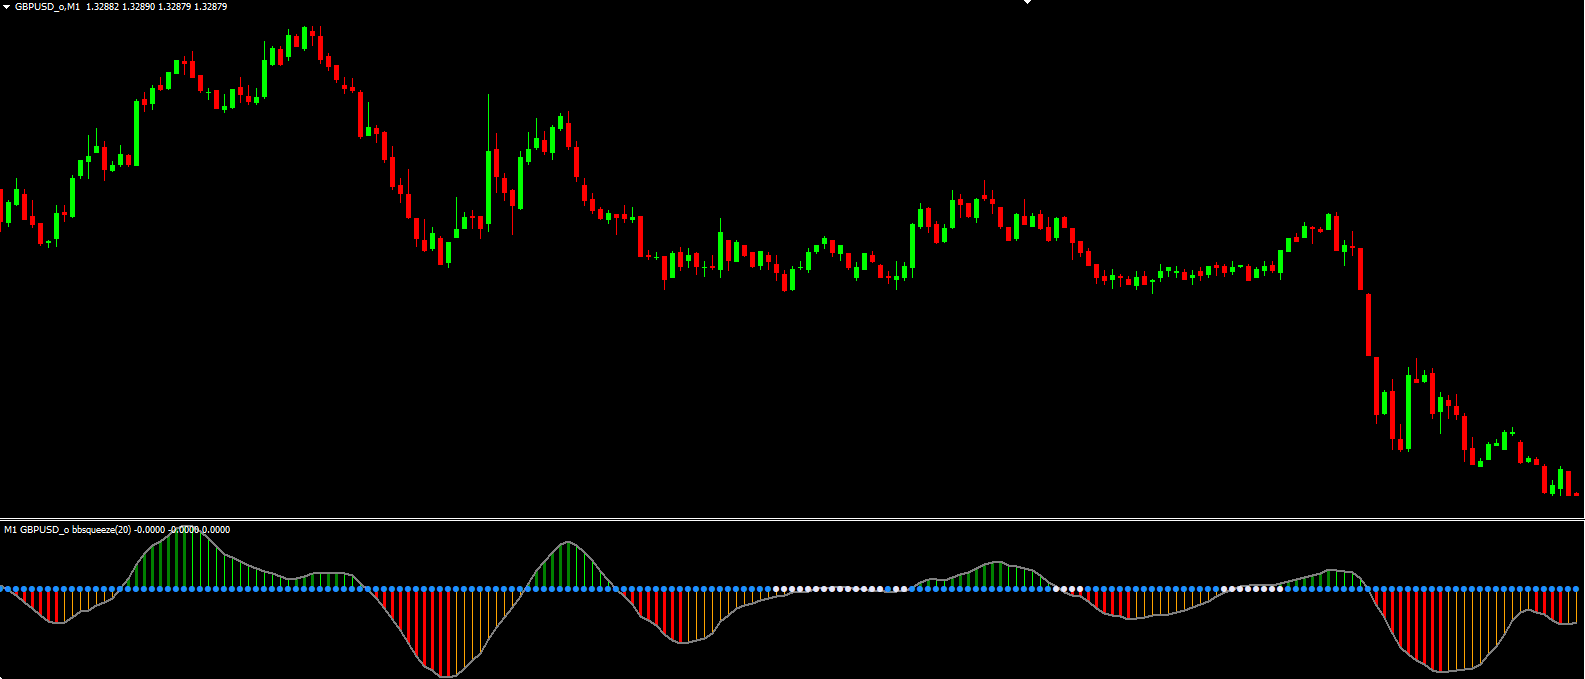
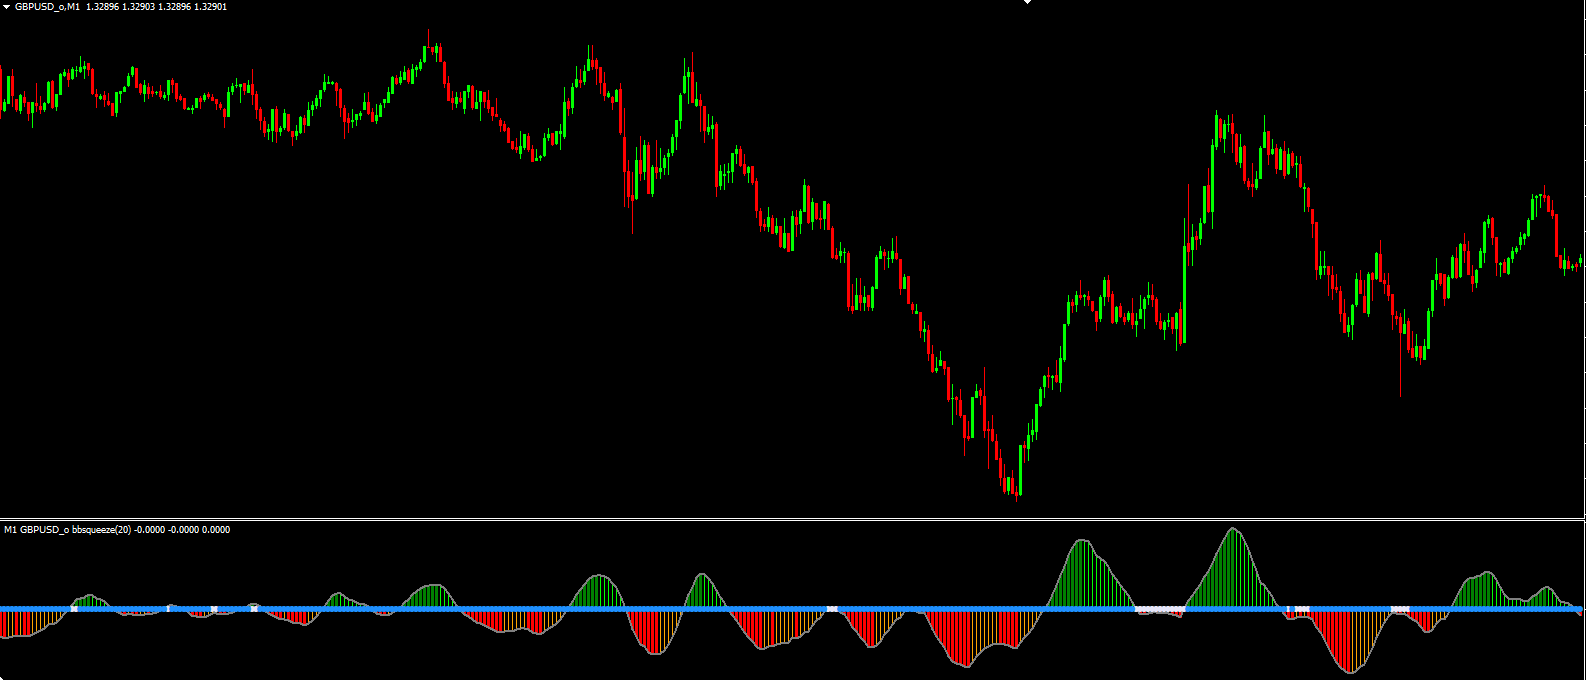
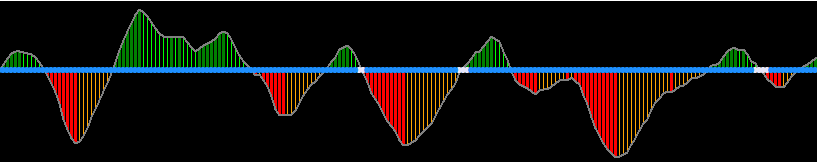
1. Visual Elements
ElementDescriptionColor
Green HistoStrong bullish momentum (lrhuu)clrLime
Orange HistoWeak bullish momentum (lrhud)clrOrange
Red HistoStrong bearish momentum (lrhdd)clrRed
Gray HistoWeak bearish momentum (lrhdu)clrGray
Up ArrowSqueeze detected (potential bullish breakout)clrGreen
Down ArrowBreakout detected (potential bearish move)clrRed
How It Works
1. Core Calculations
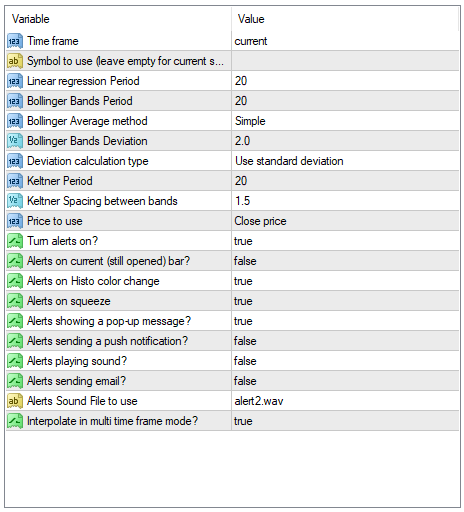
A) Bollinger Bands
Period: bolPrd (default: 20)
Deviation: bolDev (default: 2.0)
Calculation Types:
st_std (Standard Deviation)
st_ste (Standard Error)
st_sam (Sample-corrected deviation)
st_nos (Non-sample-corrected deviation)
B) Keltner Channels
Period: keltPrd (default: 20)
Spacing Factor: keltFactor (default: 1.5)
Uses ATR (Average True Range) for dynamic band width.
C) Linear Regression Slope
Period: LRPrd (default: 20)
Measures trend momentum (positive slope = bullish, negative slope = bearish).
2. Trend & Squeeze Logic
A) Trend Detection
Bullish Trend (trend=1):
When Bollinger Bands are inside Keltner Channels (low volatility).
Bearish Trend (trend=-1):
When Bollinger Bands are outside Keltner Channels (high volatility).
B) Momentum Strength (Histogram Colors)
Strong Bullish (lrhuu):
d[i] 0 (positive slope) & colors[i] == 1 (increasing momentum).
Weak Bullish (lrhud):
d[i] 0 but colors[i] == -1 (slowing momentum).
Strong Bearish (lrhdd):
d[i] 0 (negative slope) & colors[i] == -1 (increasing downward momentum).
Weak Bearish (lrhdu):
d[i] 0 but colors[i] == 1 (potential reversal).
C) Squeeze Detection
Squeeze (Up Arrow) (upK):
When trend[i] == 1 (Bollinger Bands inside Keltner Channels → low volatility).
Breakout (Down Arrow) (dnK):
When trend[i] == -1 (Bollinger Bands outside Keltner Channels → expansion).
Trading Signals
1. Buy Signals
Strong Bullish Histo (Green) → Momentum is increasing.
Squeeze Arrow (Up) → Expecting a bullish breakout.
2. Sell Signals
Strong Bearish Histo (Red) → Momentum is decreasing.
Breakout Arrow (Down) → Expecting a bearish move.
3. Weak Signals (Caution)
Weak Bullish (Orange) → Momentum may be fading.
Weak Bearish (Gray) → Potential reversal.
Alert System
The indicator can send real-time alerts for:
Histogram Color Changes (alertsOnHisto=true)
"Strong Buy" (Green appears)
"Weak Buy" (Orange appears)
"Strong Sell" (Red appears)
"Weak Sell" (Gray appears)
Squeeze/Breakout Alerts (alertsOnSqueeze=true)
"Squeeze" (Up Arrow) → Low volatility, expect breakout.
"Breaking Out" (Down Arrow) → High volatility, trend continuation.
Alert Types:
✅ Popup Messages
✅ Push Notifications
✅ Email Alerts
✅ Sound Alerts (alert2.wav)
Practical Use Cases
1. Trend Following
Trade in the direction of the histogram (Green = Long, Red = Short).
Use arrows to confirm entries (Squeeze = Prepare for breakout).
2. Mean Reversion
Fade weak signals (Orange/Gray) when price is at extreme Bollinger levels.
3. Breakout Trading
Enter when Squeeze Arrow (Up) appears, and price breaks Bollinger Bands.
Conclusion
The Hidden Power indicator is a powerful multi-purpose tool that combines:
✔ Trend identification (Bullish/Bearish)
✔ Momentum strength (Histogram colors)
✔ Volatility analysis (Squeeze detection)
✔ Multi-timeframe support