


💡 "Look at the Line" — See the Candle Mood in a Glance!
📌 Overview
"Look at the Line" is a simple yet powerful MetaTrader 4 (MT4) custom indicator developed by R.KH. It visually reflects the sentiment of the current candle using a vertical line directly on your chart. Whether you're a beginner or an experienced trader, this tool gives you a quick glance at the market's current direction—bullish, bearish, or neutral.
🛠️ Functionality & How It Works
This indicator analyzes the latest candle (bar 0) and compares its Close and Open prices:
If Close Open → Candle is Bullish, line color: Lime (Green)
If Close Open → Candle is Bearish, line color: Red
If Close == Open → Candle is Neutral, line color: Gold
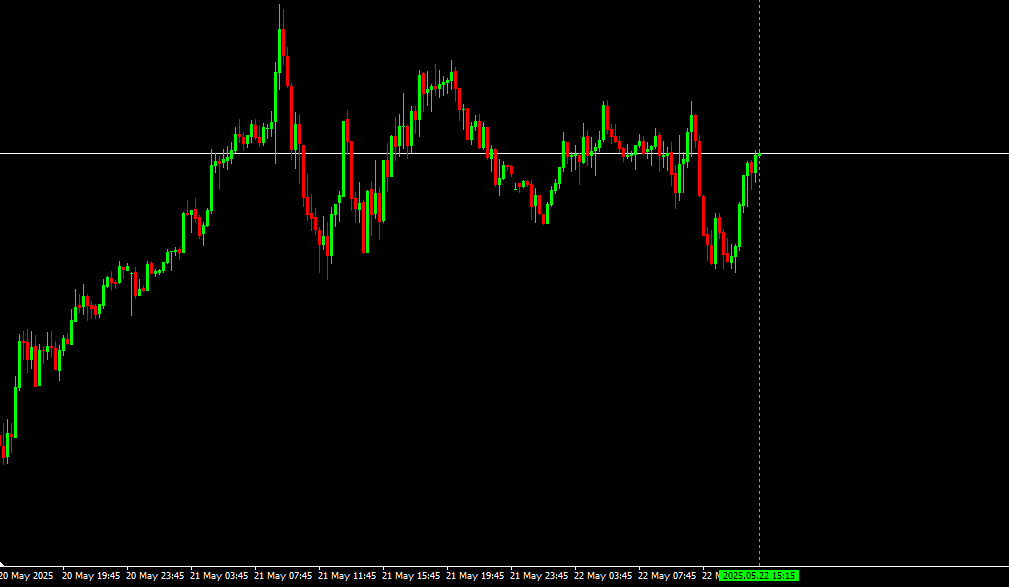
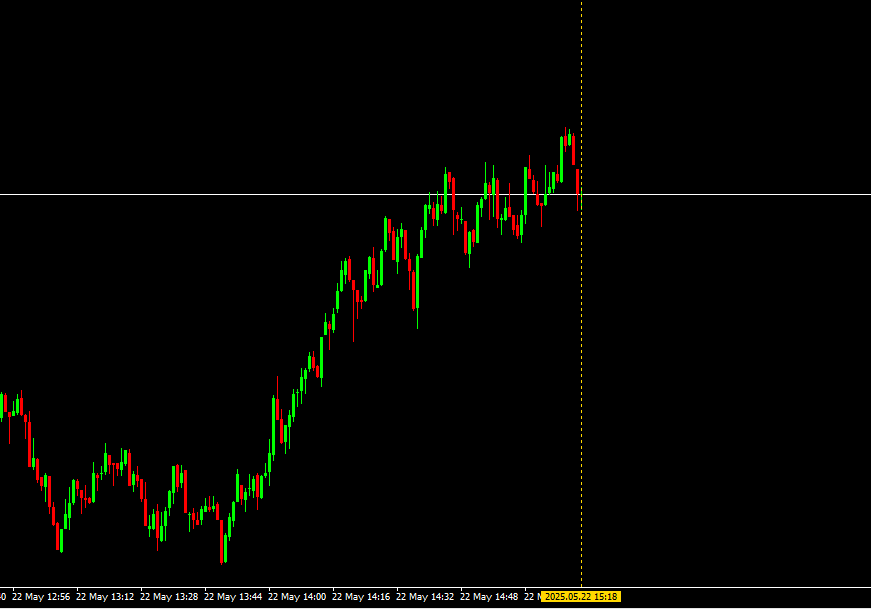
A vertical line (OBJ_VLINE) is then drawn at the time of the current candle, colored according to this mood.
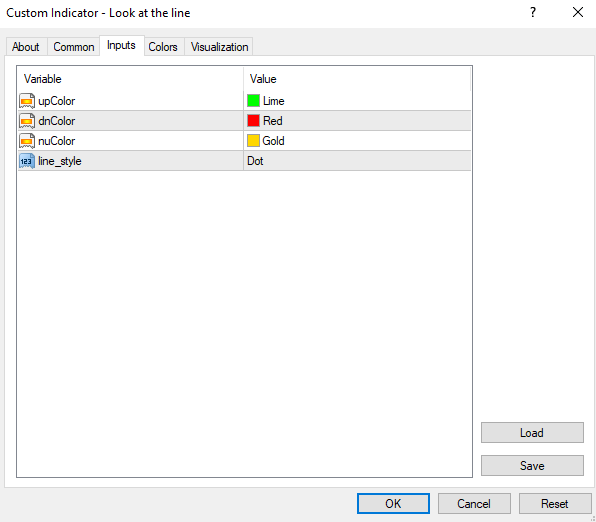
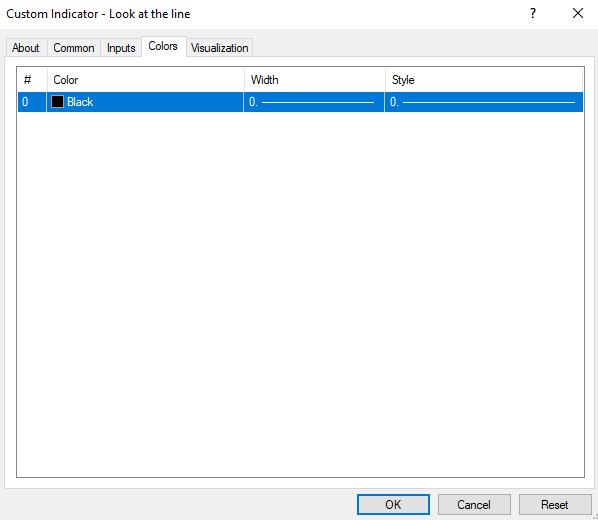
⚙️ Input Settings
The indicator includes customizable inputs:
ParameterTypeDefaultDescription
upColorcolorclrLimeColor for bullish candles
dnColorcolorclrRedColor for bearish candles
nuColorcolorclrGoldColor for neutral candles
line_styleENUM_LINE_STYLESTYLE_DOTStyle of the vertical line (dot, dash, etc.)
These inputs allow you to personalize the visual representation according to your charting preferences.
📋 Execution Steps (How It Runs)
When attached to a chart, it initializes the indicator and sets its name.
At each new tick (start() function):
It determines the color based on candle direction.
Deletes the previous line (if any).
Creates a new vertical line at the current time.
Applies the selected color, style, and width.
The process repeats on every tick, ensuring the vertical line always reflects the most recent candle.
❌ De-initialization
When removed or reloaded, the indicator deletes the drawn object ("Look at the line") to keep your chart clean.
✅ Key Benefits
Ultra-lightweight: Does not affect chart performance.
Immediate sentiment detection.
Customizable appearance.
Clean and minimal chart marking.
🔚 Credits
Developer: R.KH
Official Website: www.robomql.com
Version: 1.00
Year: 2025