
Lucky Coin 2025 Indicator - Complete Trading Guide
"Flip Your Trading Fortune - Let the Lucky Coin Reveal Market Trends!"
🔹 Overview
The Lucky Coin 2025 is a sophisticated multi-indicator system for MetaTrader 4 that combines TMA (Triangular Moving Average) channels, volatility bands, and trend ribbon visualization to identify high-probability trading opportunities. Designed by R.KH, this tool helps traders navigate both trending and ranging markets with clear visual signals.
Key Features:
✅ Dual TMA Channel System - Primary and secondary trend analysis
✅ Dynamic Volatility Bands - Adaptive to market conditions
✅ Color-Coded Trend Ribbon - Instant visual trend identification
✅ Customizable Interface - Toggle features with chart buttons
✅ Multi-Timeframe Compatible - Works across all chart periods
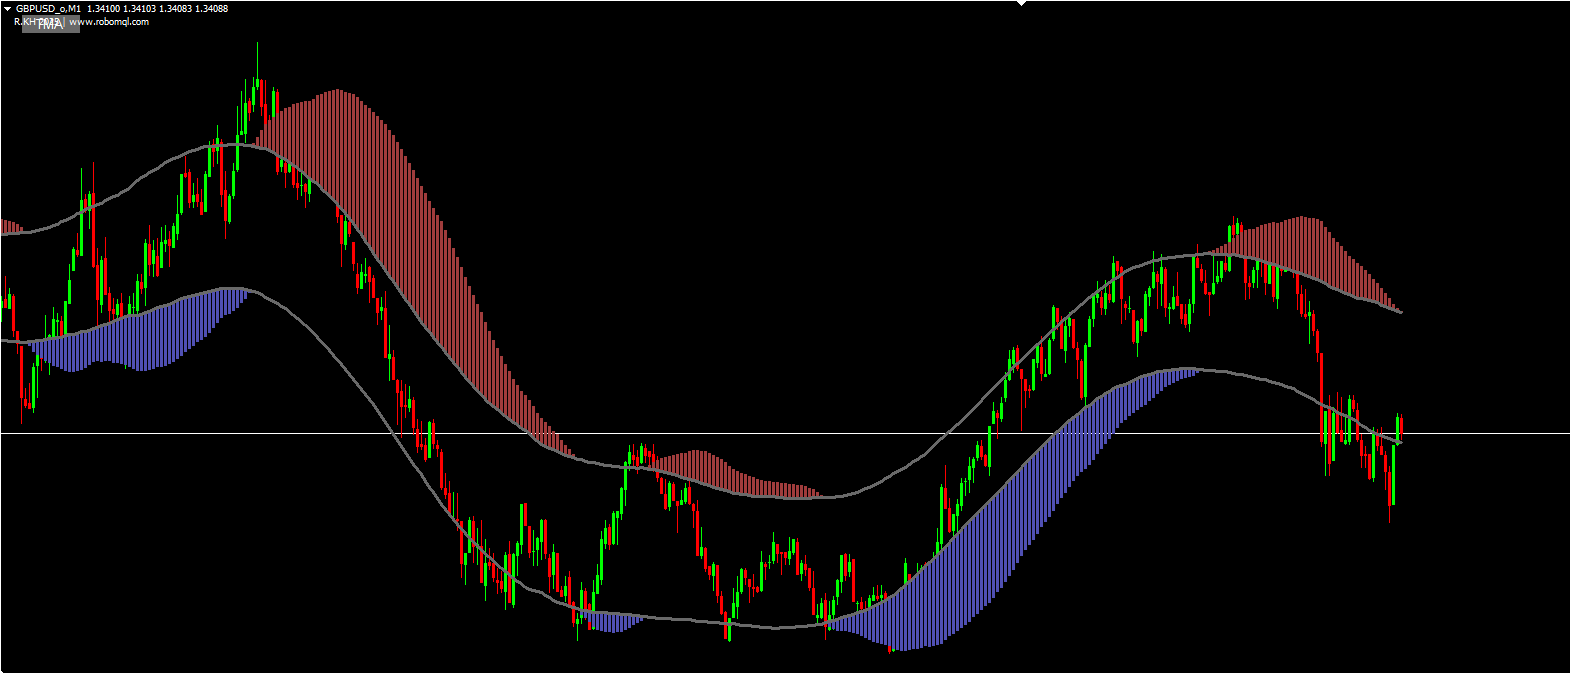
🔹 How It Works
The indicator uses three core components:
TMA1 Channel
Base LWMA (Linear Weighted Moving Average)
Volatility bands using ATR (Average True Range)
TMA2 Channel
Advanced weighted price calculation
Customizable smoothing and extrapolation
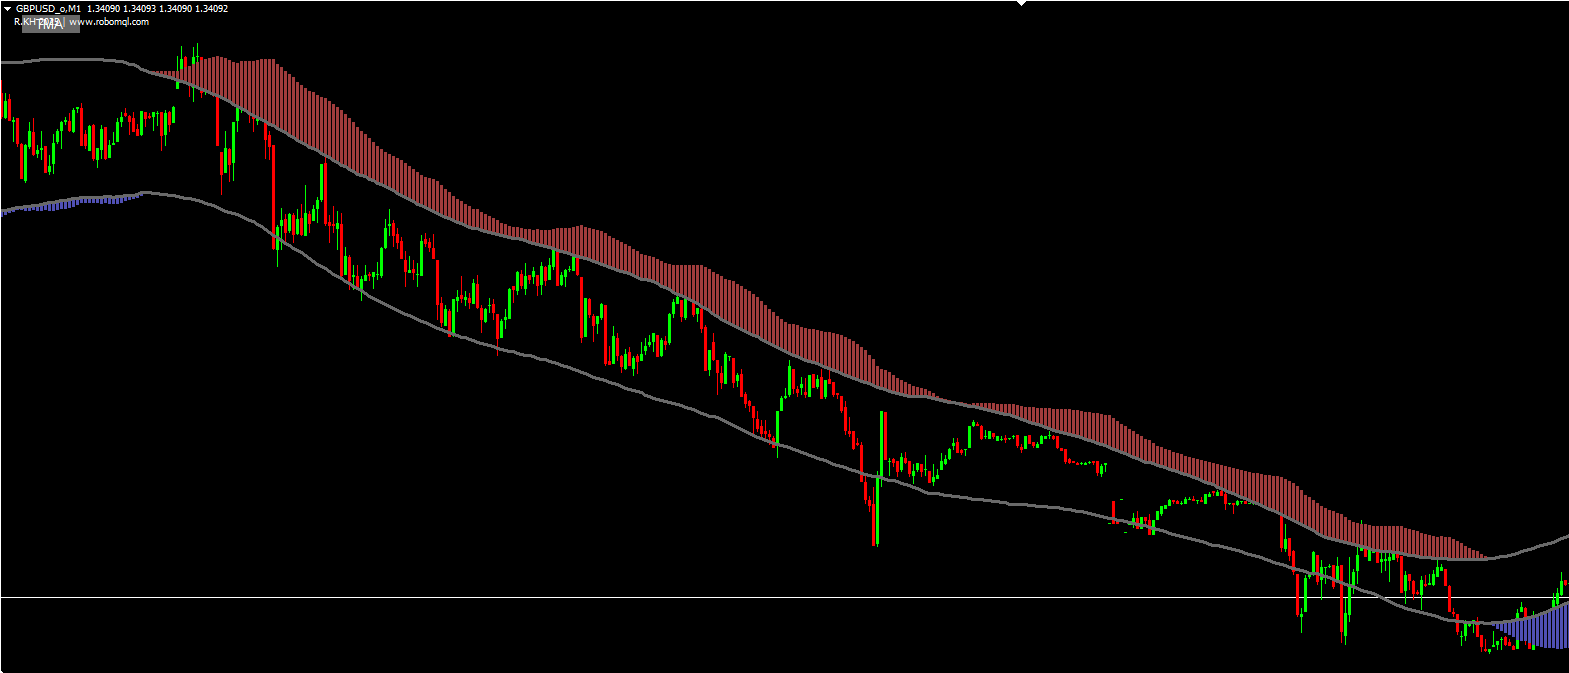
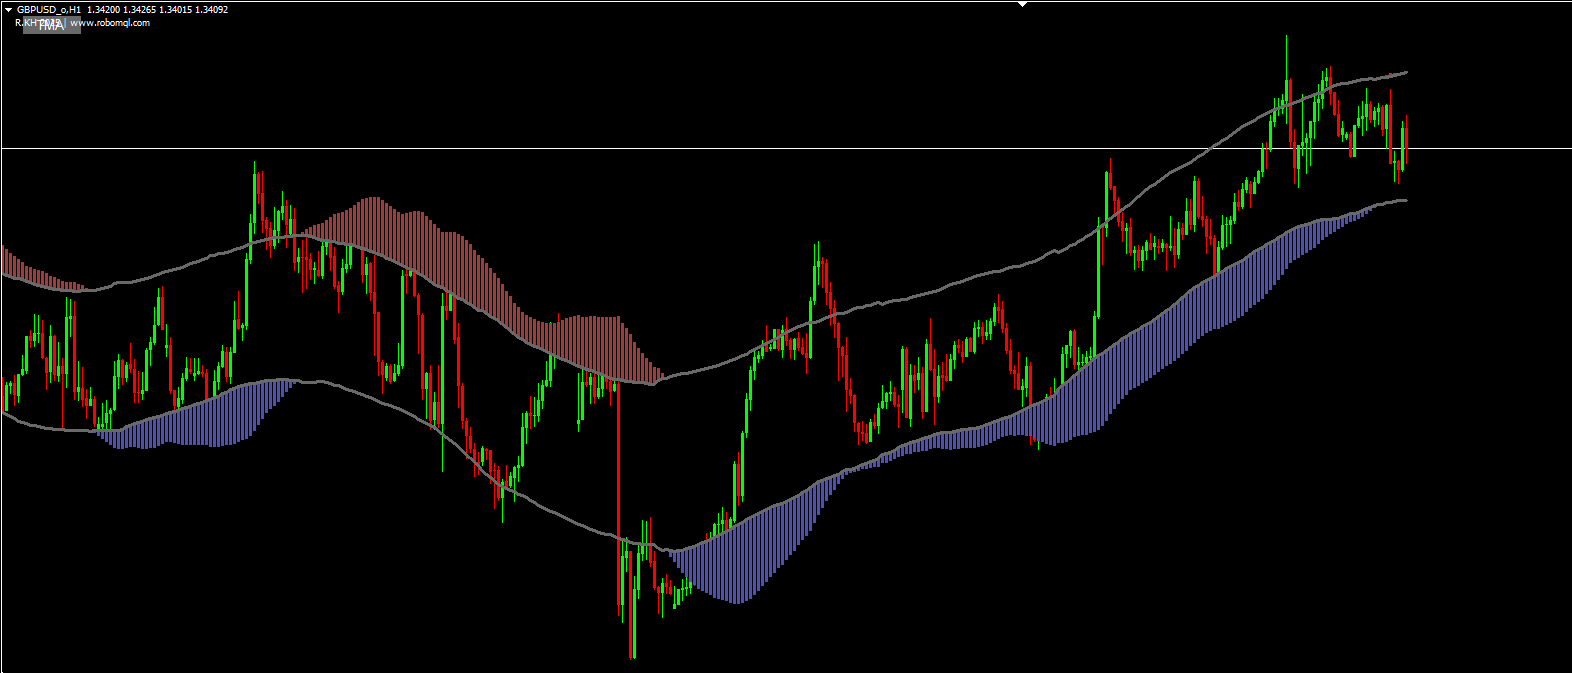
Trend Ribbon
Visual space between channels indicates trend strength
Blue = Bullish trend, Red = Bearish trend
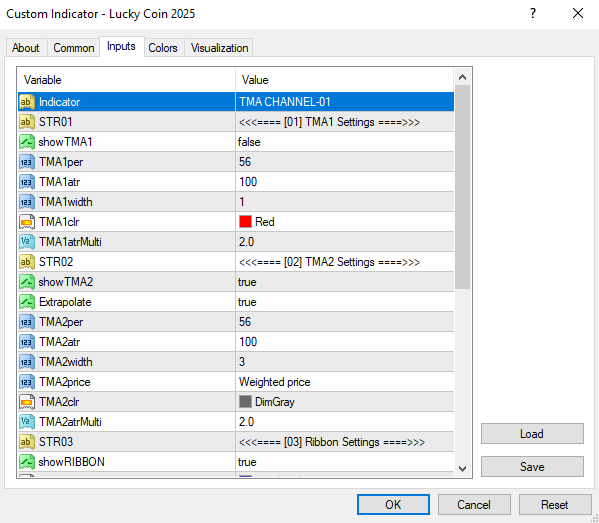
🔹 Indicator Settings & Parameters
1. TMA1 Configuration
ParameterDefaultDescription
ShowTMA1falseToggle primary channel visibility
Period56LWMA calculation period
ATR Period100Volatility measurement lookback
Width1Channel line thickness
ATR Multiplier2.0Band expansion factor
2. TMA2 Configuration
ParameterDefaultDescription
ShowTMA2trueToggle secondary channel visibility
Price TypeWeightedMA calculation price source
ExtrapolatetrueProject values beyond current bar
ColorDimGrayChannel display color
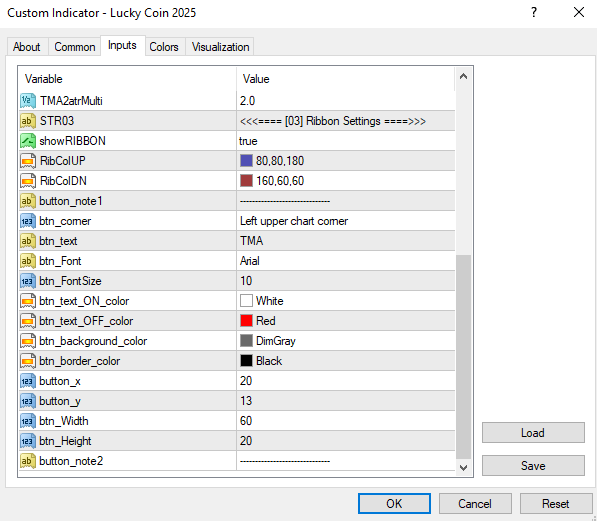
3. Ribbon Configuration
ParameterDefaultDescription
ShowRibbontrueToggle trend visualization
Bullish ColorDeep BlueUptrend ribbon color
Bearish ColorDark RedDowntrend ribbon color
4. Display Controls
Chart Button - Toggle all indicators on/off
Auto-Scaling - Adjusts line thickness based on chart zoom
🔹 Trading Strategy Recommendations
Trend Following
Enter Long when:
Price is above both TMA channels
Ribbon turns blue
TMA2 slope is positive
Enter Short when:
Price is below both TMA channels
Ribbon turns red
TMA2 slope is negative
Range Trading
Fade price touches of outer bands in non-trending markets
Use ribbon color as confirmation filter
Risk Management
Stop Placement:
Longs: Below lower TMA1 band
Shorts: Above upper TMA1 band
Take Profit:
Opposite channel as initial target
Trail stops using TMA2 slope
🔹 Advanced Tips
Combine Timeframes - Use higher timeframe for trend direction
Divergence Trading - Look for price/indicator divergences at bands
News Filter - Increase ATR multiplier during high volatility
Pair with Oscillators - RSI/MACD for overbought/oversold confirmation
🔹 Developer & Source
Developer: R.KH
Year: 2025
Website: https://www.robomql.com
"In Markets of Chance, Let the Lucky Coin Be Your Edge!" 🍀📊