
📸 Gallery
Market Profile Trendlines Indicator
Find out the exact location of the price action with the help of Market Profile indicator for MT4.
CATEGORIES: MT4, LEVELS, VOLUME
Updated on: 22.12.2023
The Market Profile Trendlines indicator depicts price density over time, highlighting the most important price levels, value area, and control value for a specific trading session.
The indicator is constructed by combining data from the volume, time, and the number of ticks at specific levels during a defined period.
This guide will dig deeper into what the MP Trendlines indicator is and how you can use it in your trading approach.
What is a Market Profile Trendlines indicator?
Market Profile indicator was developed by a Chicago Board of Trade (CBOT) trader. Its original objective was to display price and time information collected during a trading session in a way you can understand.
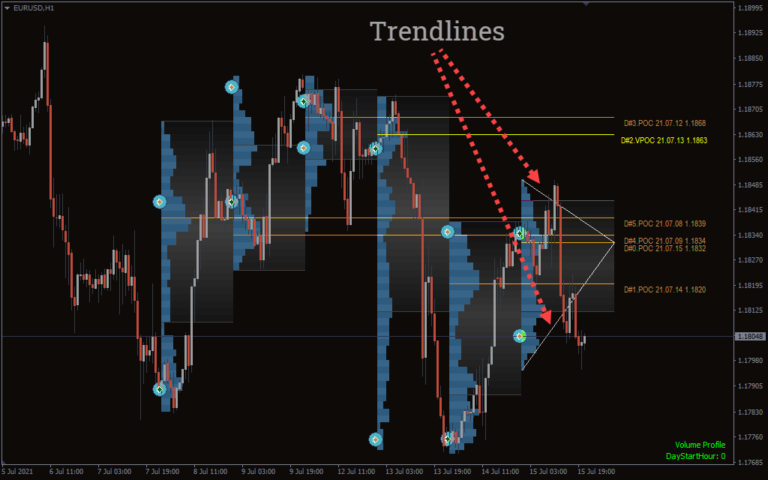
The MP Trendlines indicator is different from the traditional one, as it includes the trend lines. Also, this indicator analyzes where the most price activity is occurring in a currency pair or other market at any particular time.
It calculates using the most exact tick data – every single market tick/change. The Market Profile Trendlines indicator generates the histogram based on this.
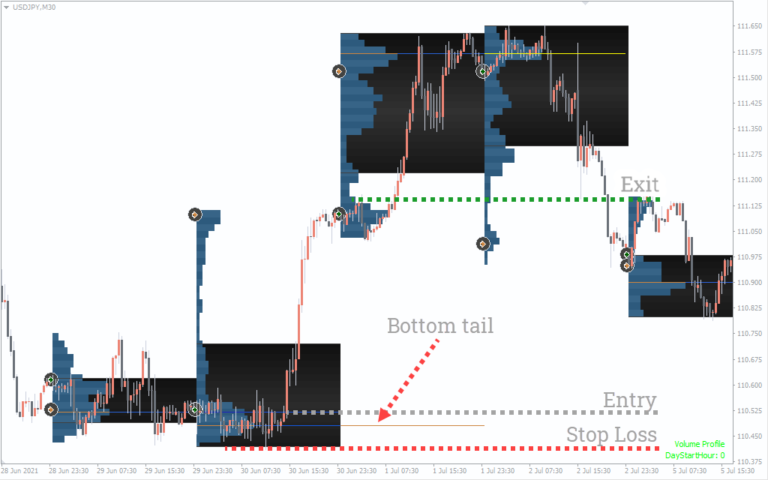
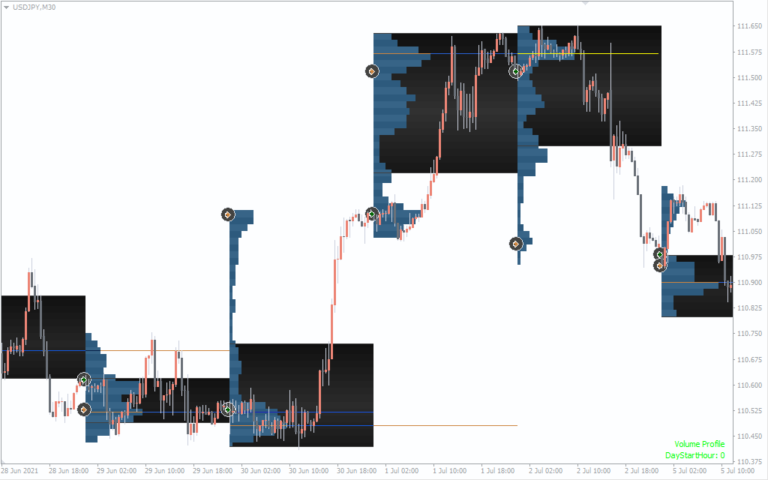
The histogram simply displays where there is a lot of trading activity and price action at certain price levels and zones. From right to left, the Market Profile Trendlines indicator draws a histogram. In contrast to the typical left-to-right layout, it can be beneficial to concentrate on the current trading session without complicating its chart.
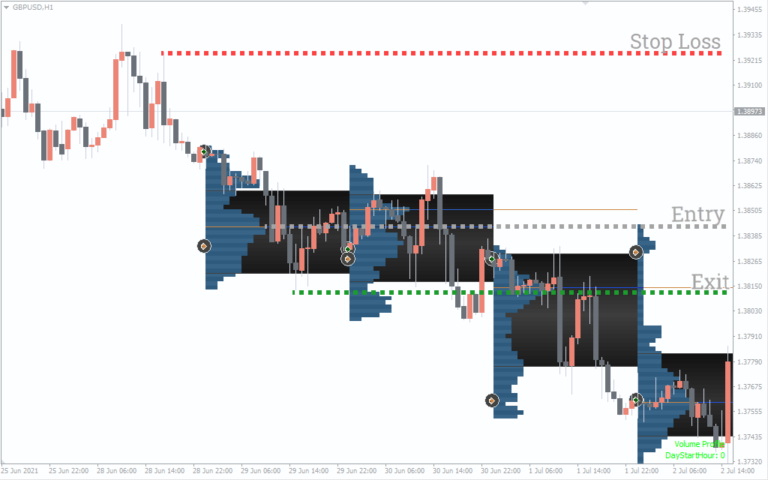
With this indicator, you will constantly be aware of the most crucial price levels and price zones for future price movements in any market.

Save time withd software.
Related products.

$0

$0

$0