
×
![]()
Multidiagonals 2.0
This indicator connects past price points drawing diagonals and trend lines, which converge in the future creating hidden reversal points.
Find hidden reversal points
Spot convergence zones easily
It shows the future short-term price range
Dense criss-cross zones are reversal points
Configurable amount of lines and price points
Configurable colors
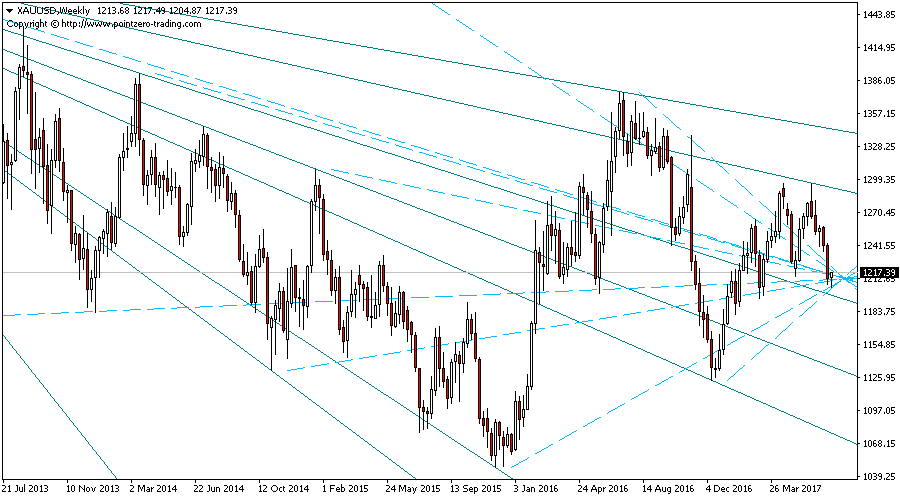
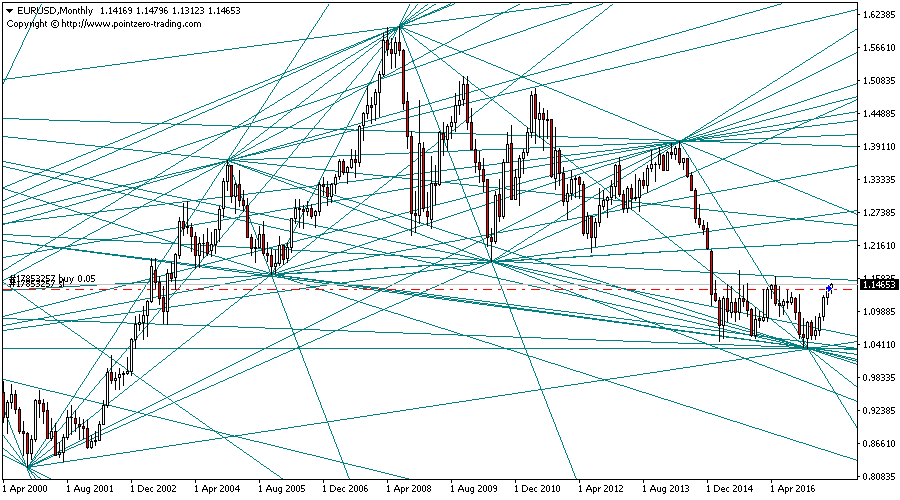
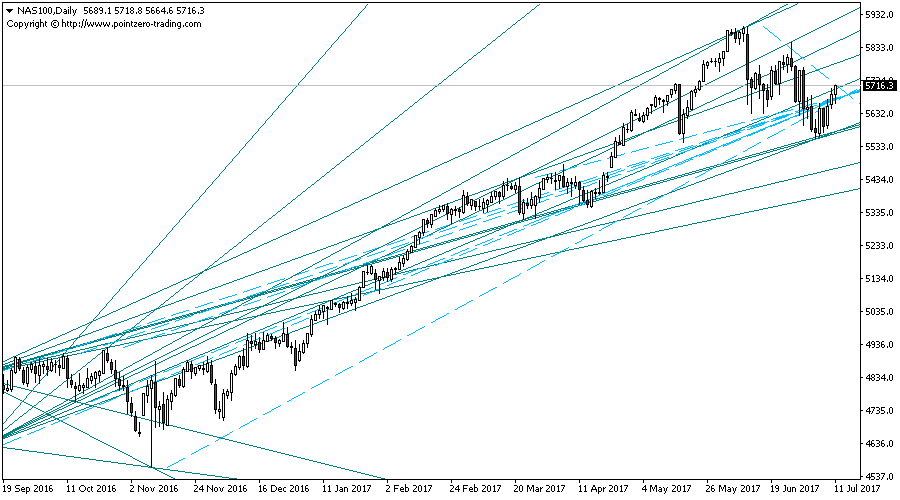
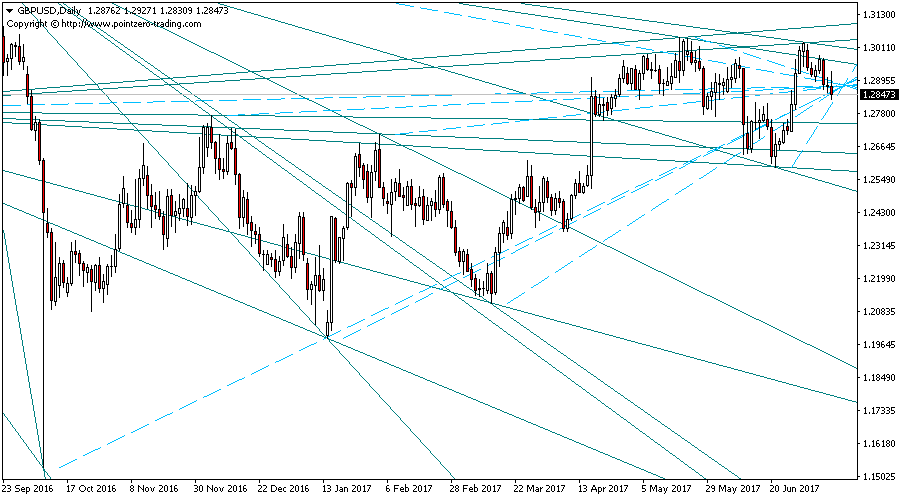
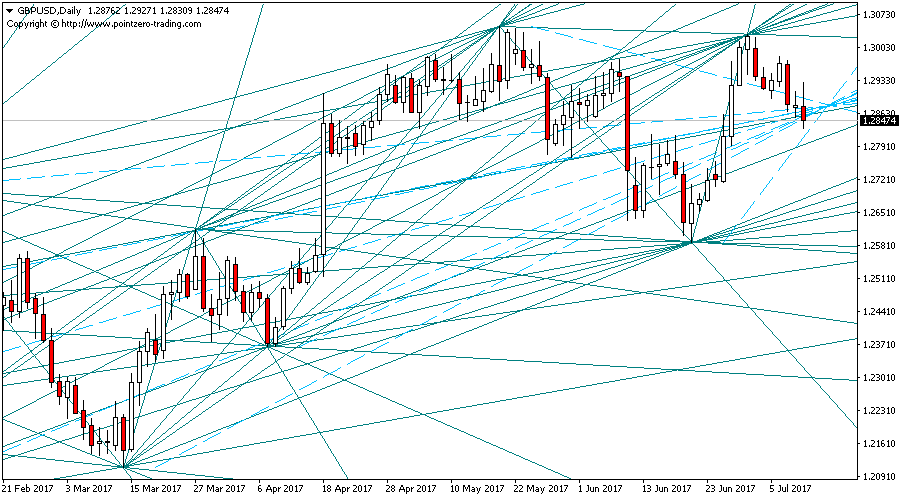
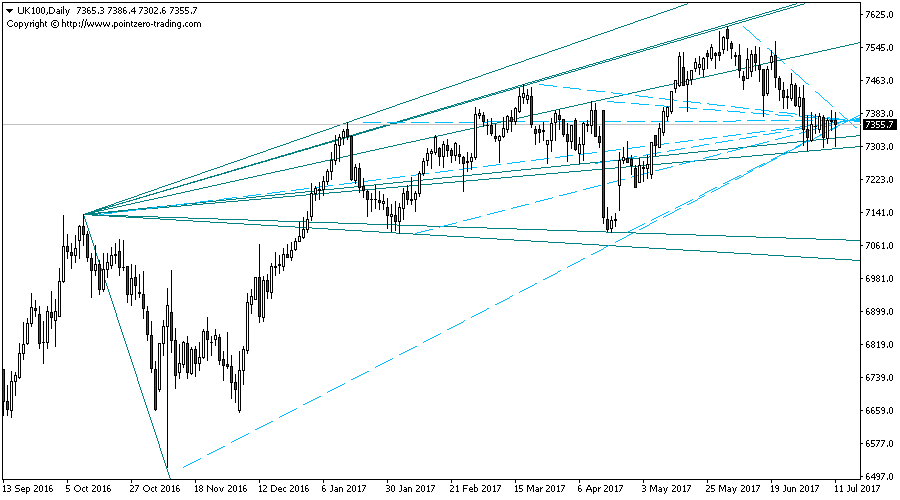
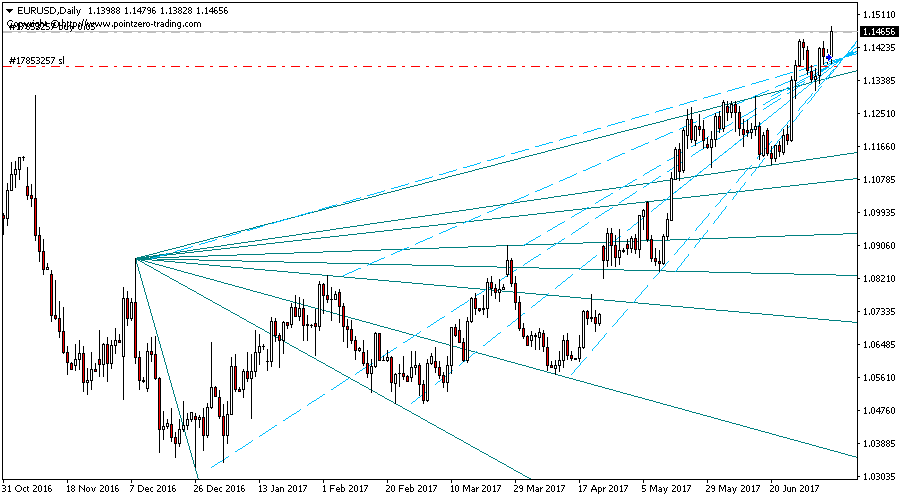
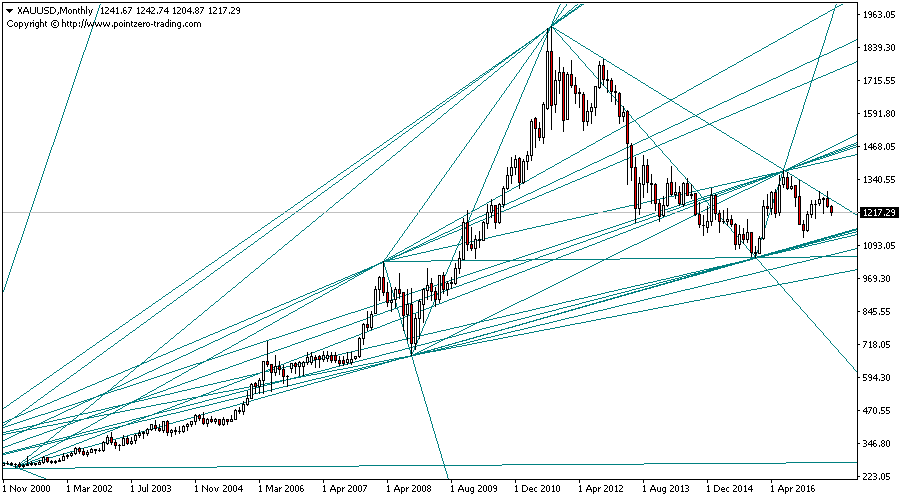
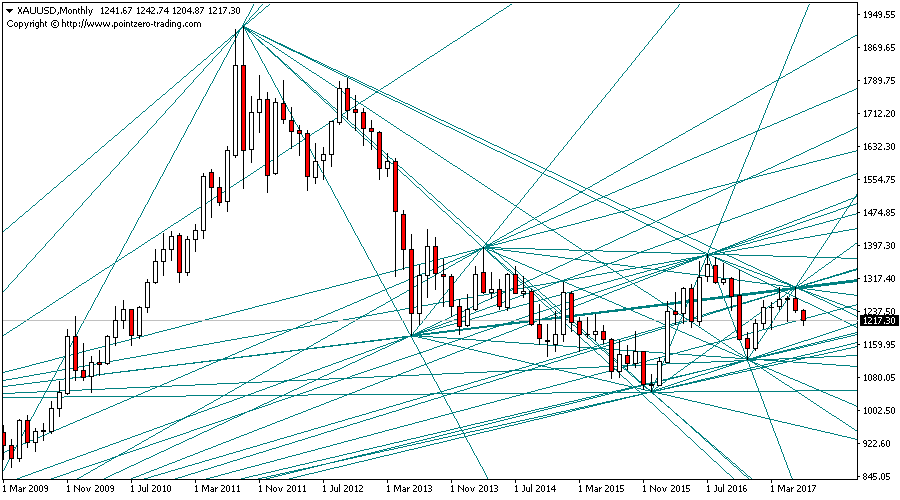
The indicator draws several lines on the chart, and where many of these lines converge and criss-cross each other in the future, a potential reversal zone exists. It also draws trend-lines and channels as a by-product of its drawing logic, as well as confluence lines, which are drawn from old past prices to the current price, projecting the foreseeable short-term future price range.
The price range projected by the confluence lines (blue lines) is the foreseeable short-term future price range.
The diagonals drawn in the chart mean nothing, but when several lines are found together or crossing each other, there is a hidden reversal zone.
Anatomy of the indicator
The indicator draws several lines in the chart, and where many of these lines converge and criss-cross each other in the future, a potential reversal zone exists. It also draws trend-lines and channels as a by-product of its drawing logic, as well as confluence lines, which are drawn from old past prices to the current price, projecting the foreseeable short-term future price range.
The price range projected by the confluence lines (blue lines) is the foreseeable short-term future price range.
The diagonals drawn in the chart mean nothing, but when several lines are found together or crossing each other, there is a hidden reversal zone.
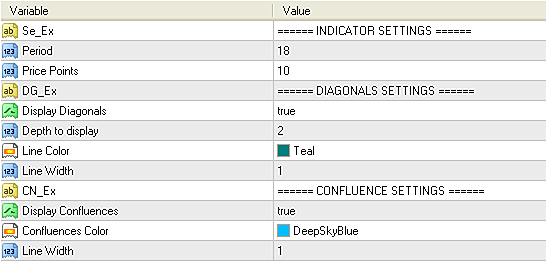
When loading the expert to any chart, you will be presented with a set of options as input parameters. Don't despair if you think they are too many, because parameters are grouped into self-explanatory blocks.
Period
This parameter controls the minimum size in bars between alternative prices points iterated by the indicator. A higher period means price points will be more separated from each other.
Price Points
This parameter is the amount of price points to select from the price history, to later connect them using lines from past to present.
Ignored Points
It is possible to prevent the indicator from drawing diagonals using the latest price points, to ascertain how accurate has been the indicator recently. By ignoring the last two price points, for example, you can see if the last two price reversals coincided with a past diagonal.
Display Diagonals
Enable this parameter to display diagonals in the chart. A diagonal is drawn by connecting a past price point with another past price point.
Depth to display
This parameter controls how many of the price points selected are connected to future price points. For example, if you choose to select 10 price points from the past and connect only 3 of them, the oldest 3 price points will be interconnected to the future, decreasing the line density.
Line Color
Choose the line color of the diagonal lines.
Line Width
Choose the line size of the diagonal lines.
Display Confluences
Enable this parameter to display confluence lines on the chart. A confluence line is drawn by connecting an old price point with the current market price, and it is useful to guess the foreseeable short-term future price range.
Line Color
Choose the line color of the confluence lines.
Line Width
Choose the line size of the confluence lines.
Save time withd software.
Related products.

$0

$0

$0