
Race Band Indicator - Bollinger Band Touch Trading System
Overview
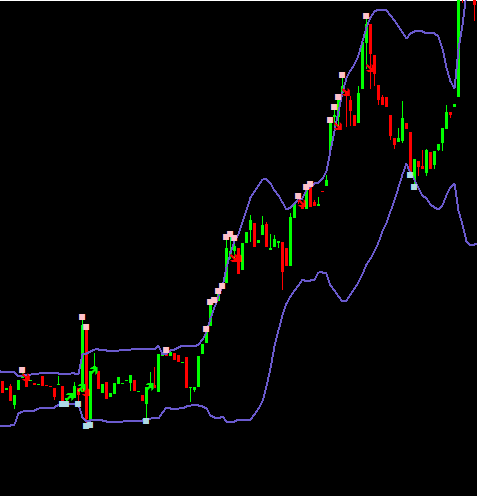
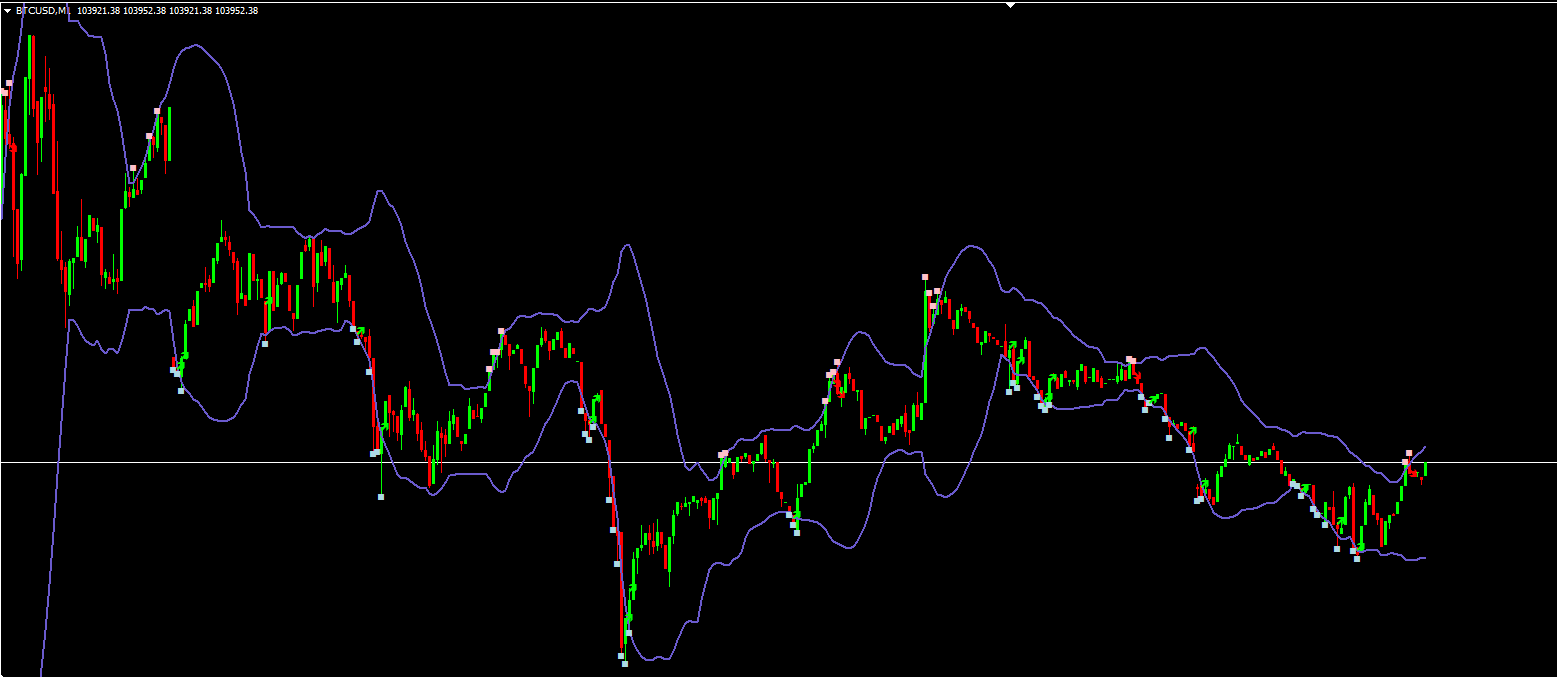
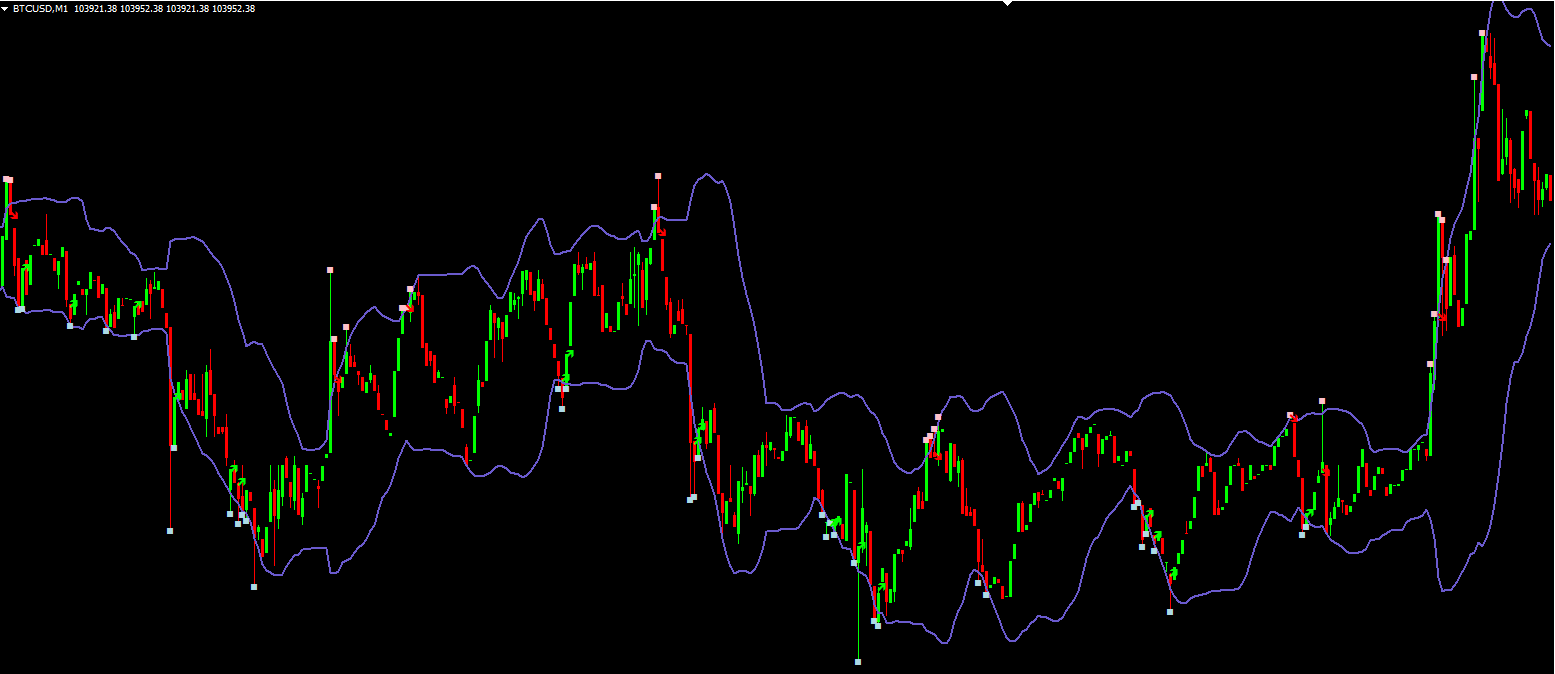
The Race Band is a powerful MT4 indicator that combines Bollinger Bands® with specialized entry signals to identify high-probability trading opportunities. It provides clear visual alerts when price touches or breaks through the bands, offering both reversal and breakout trading opportunities.
Key Features
✅ Dual Bollinger Band System - Tracks upper and lower bands with adjustable settings
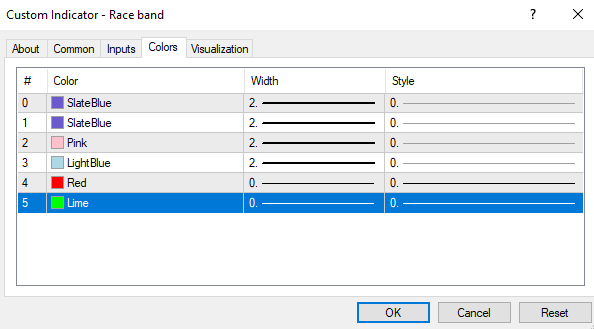
✅ Entry Signals - Arrows mark potential trade entries (blue up arrows for buys, red down arrows for sells)
✅ Touch Alerts - Visual/audio/email alerts when price touches bands
✅ Multi-Timeframe Support - Works on all timeframes from M1 to monthly
✅ Customizable Alerts - Configure popup, sound, email and mobile notifications
How It Works
The indicator uses a two-step approach:
1. Band Touches (Initial Signal)
Red diamond (167) appears when price touches upper band (potential sell)
Blue diamond (167) appears when price touches lower band (potential buy)
2. Confirmed Entries (Follow-Up Signal)
Green up arrow (236) confirms buy when price pulls back from lower band then moves up
Red down arrow (238) confirms sell when price rejects upper band then moves down
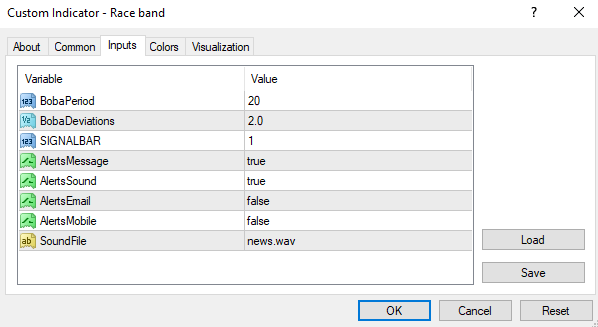
Indicator Settings
ParameterDescriptionRecommended Value
BobaPeriodBollinger Band period20 (default)
BobaDeviationsStandard deviations2.0 (default)
SIGNALBARWhich bar to check for signals1 (most recent closed bar)
AlertsMessageEnable popup alertstrue/false
AlertsSoundEnable sound alertstrue/false
SoundFileAlert sound file"news.wav"
How to Trade with Race Band
Buy Rules
Wait for blue diamond at lower band
Confirm with green arrow on pullback
Enter long with stop below recent low
Target next resistance or upper band
Sell Rules
Wait for red diamond at upper band
Confirm with red arrow on rejection
Enter short with stop above recent high
Target next support or lower band
Best Trading Conditions
Works best in trending markets
Avoid during flat/choppy conditions
Most reliable on H1 and higher timeframes
Indicator Philosophy
🔹 "Trade the bands - when price races to the edges, prepare for the rebound!"
This indicator is perfect for traders who want to:
Catch mean reversion trades at band extremes
Trade breakouts with confirmation
Automate their alert system
Pro Tips
Combine with RSI - Only take buys when RSI 30 and sells when RSI 70
Adjust Deviations - Use 1.5 for tighter ranges, 2.5 for more volatile instruments
Timeframe Synergy - Check alignment on higher timeframe for stronger signals
🚀 Example Setup:
H4 chart
BobaPeriod=20, Deviations=2.0
Only take signals that align with daily trend