
×
![]()
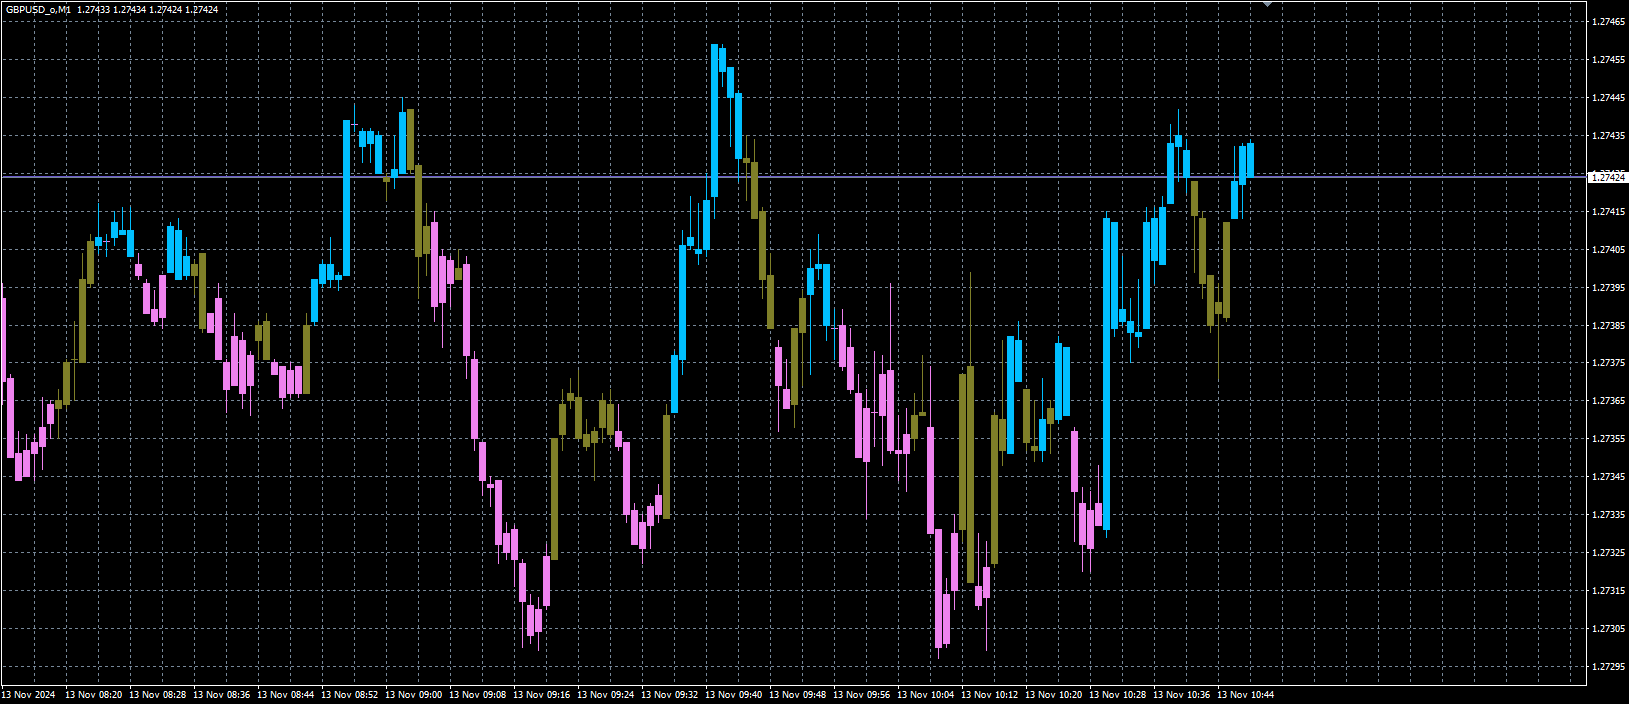
Real power Indicator Explanation
This is a custom MetaTrader 4 (MT4) indicator called "TrendBars" that visually represents market trends using colored histogram bars based on two CCI (Commodity Channel Index) indicators.
How It Works
Indicator Setup:
It uses 8 buffers for drawing different colored bars
Creates a horizontal line object called "Close line" that tracks the current closing price
The sensitivity can be adjusted (0-3) which changes the CCI periods
CCI Calculation:
Uses two CCI indicators with different periods:
Short-term CCI (g_period_84): Period varies from 5 to 89 based on sensitivity
Long-term CCI (g_period_80): Period varies from 14 to 200 based on sensitivity
Default setting (sensitivity=2) uses CCI(8) and CCI(34)
Bar Coloring Logic:
The indicator colors the bars based on the relationship between the two CCI values:
Strong Uptrend (Blue/Violet bars):
When both CCI values are ≥ 0
Body: Blue top (g_ibuf_88), Violet bottom (g_ibuf_92)
Wicks: Blue upper (g_ibuf_104), Violet lower (g_ibuf_108)
Weak Uptrend (Gold bars):
When long-term CCI ≥ 0 but short-term CCI 0
Body: Gold top (g_ibuf_96), Gold bottom (g_ibuf_100)
Wicks: Gold upper (g_ibuf_112), Gold lower (g_ibuf_116)
Strong Downtrend (Inverted Blue/Violet bars):
When both CCI values are 0
Body: Violet top (g_ibuf_92), Blue bottom (g_ibuf_88)
Wicks: Violet upper (g_ibuf_108), Blue lower (g_ibuf_104)
Weak Downtrend (Inverted Gold bars):
When long-term CCI 0 but short-term CCI 0
Body: Gold top (g_ibuf_100), Gold bottom (g_ibuf_96)
Wicks: Gold upper (g_ibuf_116), Gold lower (g_ibuf_112)
Visual Elements:
The "Close line" (SlateBlue) shows the current price level
Histogram bars show the price action colored according to trend strength/direction
Bar widths are set to 4 pixels for good visibility
Interpretation
This indicator provides a visual representation of trend strength and direction:
Blue/Violet bars indicate strong trends (up or down)
Gold bars indicate weaker or potentially reversing trends
The horizontal line helps identify the current price level relative to the trend