
📈 Rebecca Indicator (Cronex Taichi) – Full Guide
🔍 What Is the Rebecca Indicator?
The Rebecca Indicator, also labeled as Cronex Taichi, is a hybrid trend-following tool based on the Ichimoku Kinko Hyo system. It combines several components of Ichimoku (Tenkan-sen, Kijun-sen, Senkou Span A, Senkou Span B, and Chinkou Span) to form a smoothed trend cloud and momentum signal lines for better decision-making in trending markets.
This indicator aims to:
Identify the dominant trend direction.
Spot potential reversals or pullbacks.
Highlight flat zones (market ranging) through histogram channels.
It is particularly helpful for:
Swing trading
Trend trading
Avoiding entries during low volatility (flat) phases
🛠️ How It Works
The indicator uses:
Taichi Line: A dynamic average of Tenkan-sen, Kijun-sen, Senkou Span A and B. It reflects the "overall market mood."
Signal Line & SSignal Line: Weighted Moving Averages (WMA) of the Taichi Line. These help identify crossovers and momentum shifts.
Flat Zones: Two histogram buffers indicate when price action is too close or compressed — a sign of consolidation or lack of direction.
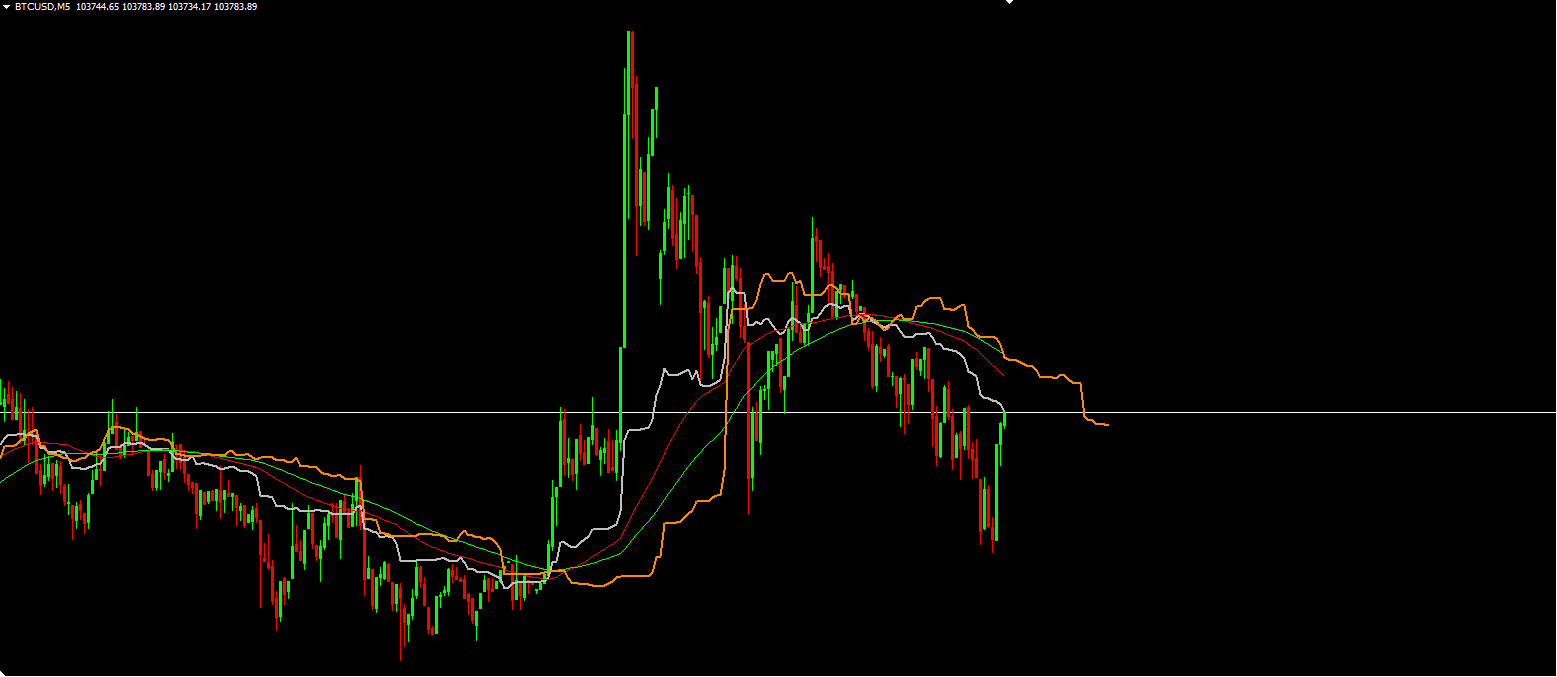
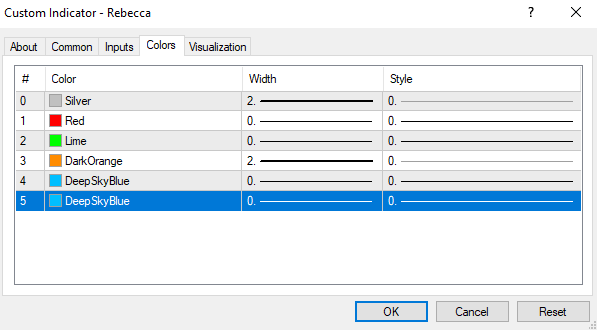
Visual Components:
Silver Line: Taichi (main trend line)
Red & Lime Lines: Signal and Secondary Signal Lines (momentum guides)
DarkOrange & DeepSkyBlue Histograms: Visual zones of flatness, range, or caution
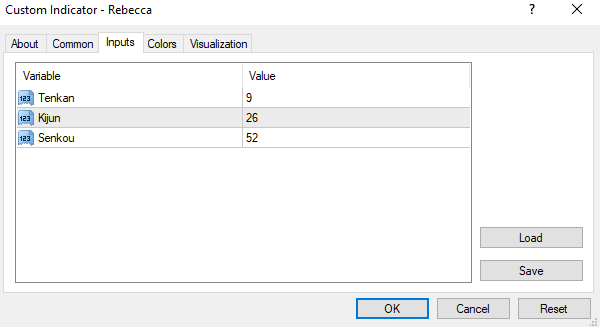
Explanation:
Tenkan (Default 9): Fast-moving average. Short-term trend sensitivity.
Kijun (Default 26): Mid-term trend detector. Supports crossovers.
Senkou (Default 52): Long-term trend projection and cloud width control.
Adjusting these affects responsiveness. Lower values = more responsive but noisier signals. Higher values = smoother, but lagging.
✅ How to Use It
Trend Identification:
When the Taichi Line (Silver) is rising and above Signal lines, the market is bullish.
When the Taichi Line is falling and below, the market is bearish.
Signal Crossovers:
When the Signal Line (Red) crosses above the Taichi → Consider long positions.
When it crosses below → Consider short positions.
Flat Detection:
Orange/Blue histograms appear when the market is ranging.
Avoid trading in these zones unless you're scalping or trading breakouts.
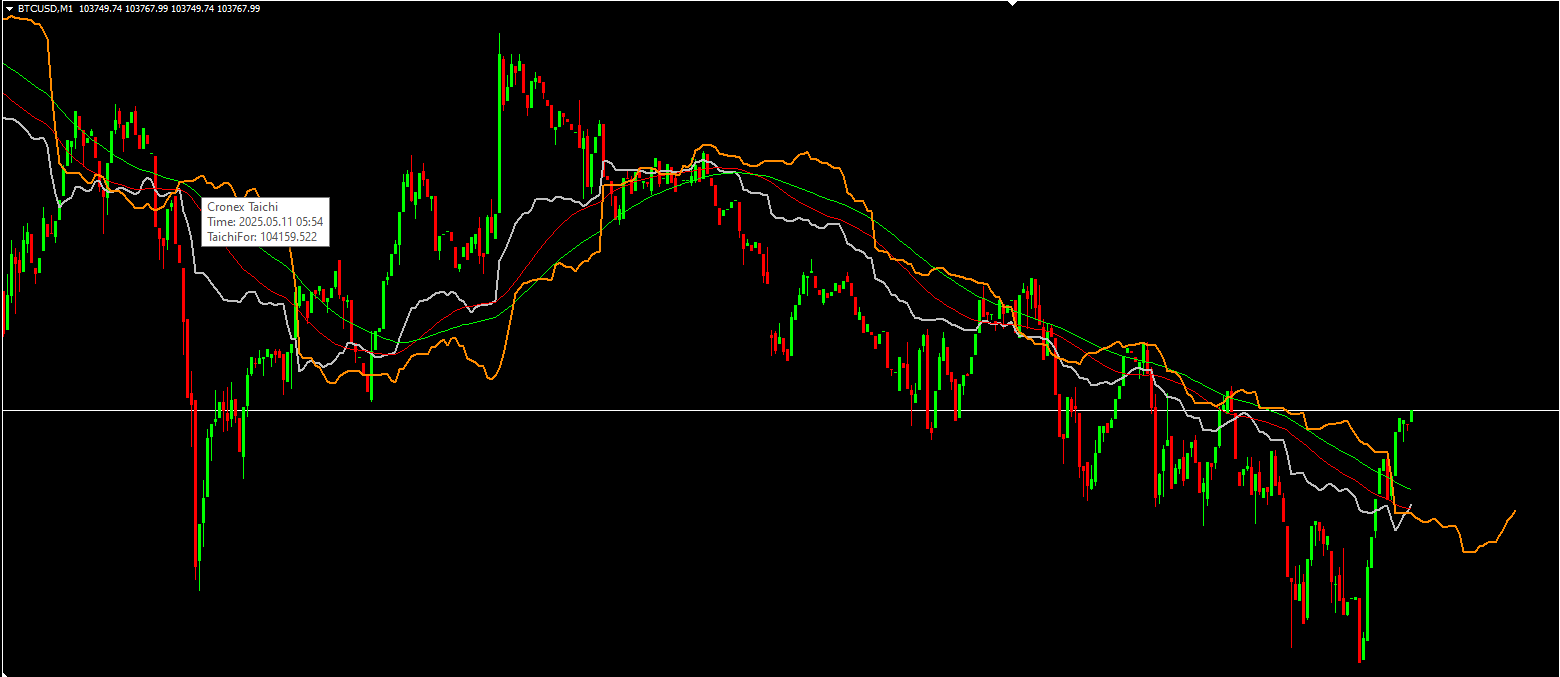
Forecasting:
TaichiForBuffer shifts the cloud forward (like Senkou spans in Ichimoku).
Gives a visual of projected support/resistance zones.
🧠 Pro Tips
Combine this indicator with price action or support/resistance levels.
Avoid trading solely on crossovers in low-volume periods.
Use it on H1 to D1 timeframes for better reliability.
Works well on Forex, Gold, and Indexes.
🗣️ Slogan for Rebecca (Cronex Taichi)
"Rebecca – Let the Market Speak, Follow the Cloud of Clarity."