
Comprehensive Analysis of the "RED MAN" Indicator (MQL4)
This custom indicator, named "RED MAN", is a sophisticated trend-following oscillator that combines price action filtering, cycle analysis, and momentum detection to generate trading signals. Below is a detailed breakdown of its structure, logic, and practical applications.
1. General Overview
Indicator Name: RED MAN
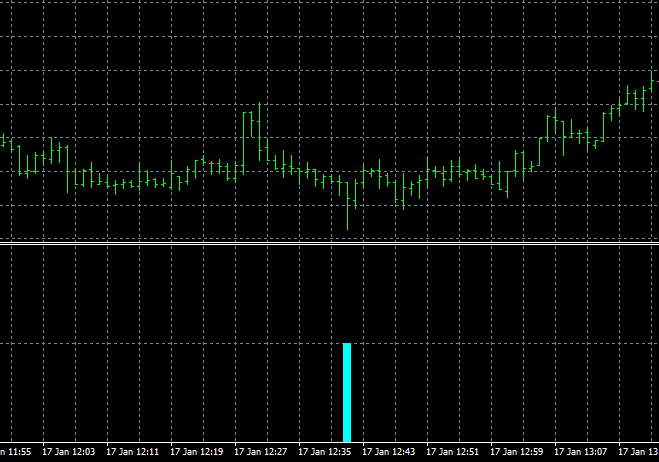
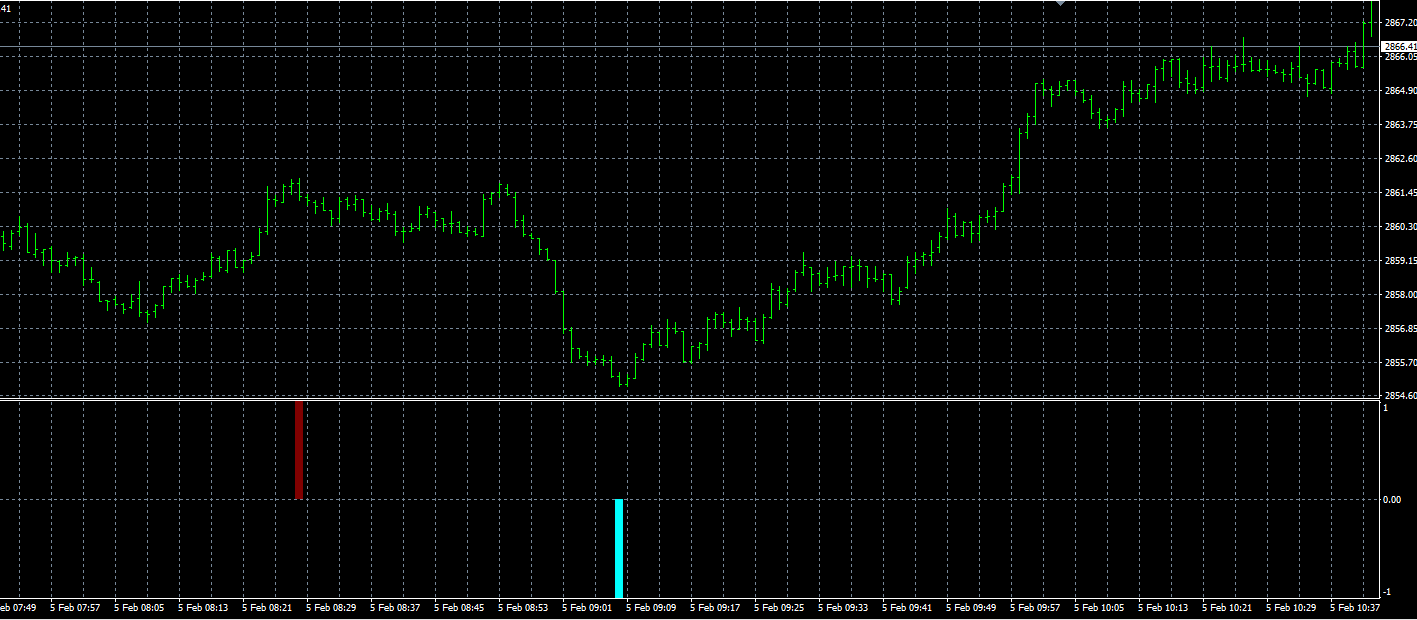
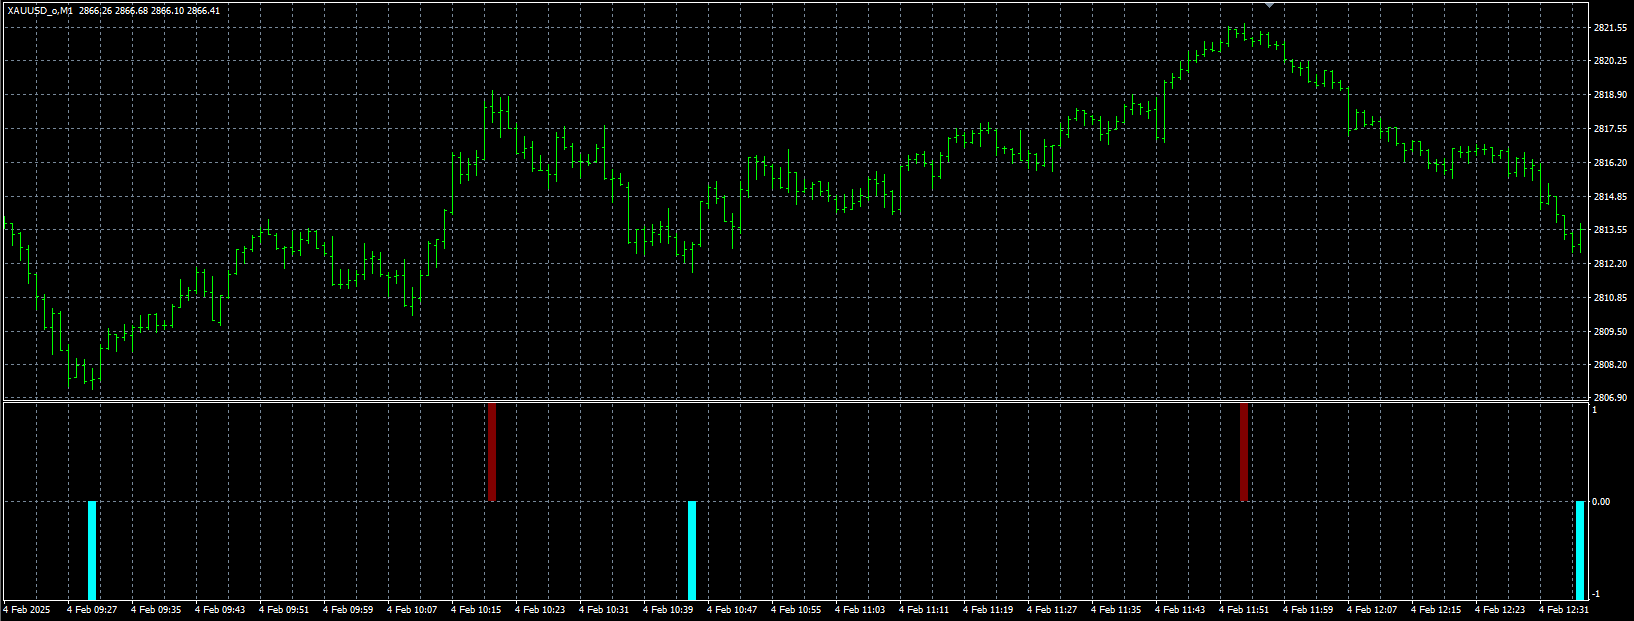
Type: Separate window oscillator (-1.0 to +1.0 range)
Primary Purpose: Identifies trend reversals, momentum shifts, and cyclical patterns using adaptive filtering.
Key Features:
Price Action Filtering (SMMA-based)
Cycle Strength Detection (Major/Minor cycles)
Optional SMA/RSI Filters for additional confirmation
2. Input Parameters
Core Settings
ParameterDefaultDescription
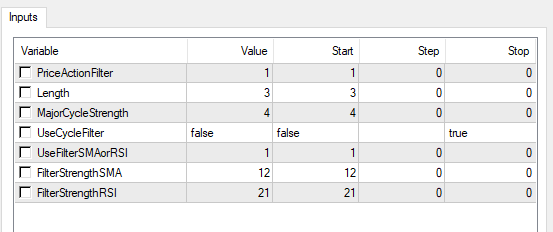
PriceActionFilter1Smoothing period for the base moving average (SMMA).
Length3Lookback period for volatility adjustment.
MajorCycleStrength4Multiplier for major cycle detection (stronger trends).
Filtering Options
ParameterDefaultDescription
UseCycleFilterFALSEEnables/disables cycle-based trend filtering.
UseFilterSMAorRSI11 = SMA / 2 = RSI for secondary confirmation.
FilterStrengthSMA12SMA period for trend confirmation.
FilterStrengthRSI21RSI period for trend confirmation.
3. Indicator Buffers
The indicator uses 6 buffers (arrays storing calculated values):
Buffer IndexNameDescriptionColorStyle
0g_ibuf_104Hidden (auxiliary calculations)BlackNone
1g_ibuf_108Bearish Signals (Major Cycle)AquaThick Histogram
2g_ibuf_112Bullish Signals (Major Cycle)MaroonThick Histogram
3g_ibuf_116Bearish Signals (Minor Cycle)BlackNone
4g_ibuf_120Bullish Signals (Minor Cycle)BlackNone
5g_ibuf_124Filter Output (SMA/RSI)BlackNone
4. How It Works
Core Logic
Price Smoothing
Uses Smoothed Moving Average (SMMA) of PriceActionFilter period to filter noise.
Adjusts sensitivity based on Length (volatility scaling).
Cycle Detection
Major Cycles (Strong Trends):
Detected when price moves exceed MajorCycleStrength * Average Range.
Plotted as Aqua (Bearish) / Maroon (Bullish) histograms.
Minor Cycles (Weak Trends):
Filtered out unless UseCycleFilter = TRUE.
Optional Confirmation Filters
SMA Filter: Uses a Zero-Lag SMA to reduce lag.
RSI Filter: Applies Zero-Lag RSI for momentum confirmation.
Signal Generation
Bullish Signal (g_ibuf_112 = +1):
Price breaks above a smoothed resistance level with cycle confirmation.
Bearish Signal (g_ibuf_108 = -1):
Price breaks below a smoothed support level with cycle confirmation.
5. Trading Strategy
Entry Conditions
Buy Signal:
g_ibuf_112 turns Maroon (bullish histogram).
Confirmed by SMA/RSI filter (if enabled).
Sell Signal:
g_ibuf_108 turns Aqua (bearish histogram).
Confirmed by SMA/RSI filter (if enabled).
Exit Conditions
Take Profit: When the opposite signal appears.
Stop Loss: Based on volatility-adjusted thresholds (Length parameter).
6. Strengths & Weaknesses
✅ Advantages
Adaptive to Market Conditions: Adjusts sensitivity based on volatility.
Reduces False Signals: Optional SMA/RSI filters improve accuracy.
Clear Visuals: Histogram format makes signals easy to interpret.
❌ Limitations
Lag in Ranging Markets: May produce late signals in choppy conditions.
Complex Logic: Requires careful parameter tuning.
7. Recommended Settings
Trading StylePriceActionFilterLengthMajorCycleStrengthUseFilterSMAorRSI
Scalping1-3231 (SMA)
Swing5-10452 (RSI)
Trend-Following10+661 (SMA)
8. Conclusion
The RED MAN indicator is a powerful trend-following tool best used in strong trending markets. Its adaptive filtering helps reduce noise, while the cycle detection improves signal reliability.