📸 Gallery


Reversal Bar Indicator
A reversal bar is a single bar or candlestick on a price chart that signals a potential change in the direction of the market trend. The reversal bar indicator scans price action to identify reversal bars and alerts traders to these high probability turning points in the market.
Reversal bars are important because they mark exact levels where buyers take control from sellers, or vice versa. Plotting these pivotal points as an indicator on a price chart provides traders with a visual tool to improve the timing of entries and exits. The indicator also helps confirm trend reversals.
This article will explore the key concepts behind the reversal bar indicator, including:
What reversal bars are and why they are significant
How the reversal bar indicator works
Interpreting common reversal bar patterns
Using the indicator to define support and resistance
Incorporating reversal bars into a trading strategy
Tips and precautions for trading with the indicator
Example setups and trading scenarios
Understanding price action is a fundamental skill of professional traders. The reversal bar indicator is a valuable addon tool for spotting high probability turning points derived directly from the price bars on the chart.
Reversal Bar Indicator
What is a Reversal Bar?
A reversal bar refers to a single bar or candlestick on the price chart that signals a potential reversal in the direction of the trend. It represents a level where bulls (buying pressure) take control from bears (selling pressure), or vice versa. This transition is reflected in the open, high, low and close values of the bar.
There are a few characteristics that define a bar as a reversal bar:
The open and close are at opposite ends of the bar, creating a large body. This shows a transition from bullish to bearish sentiment or vice versa within that bar’s timeframe.
The close is near the high/low of the bar. This indicates buyers/sellers took control and pushed the price to the extreme range of that period.
There is little or no overlap with the previous bar. Overlap shows indecision so low overlap strengthens the signal.
Large bar range and above average volume (where available) support the conviction behind the reversal.
When these qualities come together, the bar signals a high probability reversal point in the market. Isolating and plotting these bars on the chart makes them readily visible to traders.
Why Reversal Bars Are Important
There are a few key reasons experienced traders pay close attention to reversal bars:
They clearly signify transition points between buyers and sellers. Knowing who is in control gives an edge.
They condense the complex dynamics of markets into simple visual patterns. This makes analysis easier.
They isolate exact levels/prices where reversals occurred previously. This creates logical support and resistance levels.
They provide high probability reversal trade setups with predefined risk and profit targets.
They help confirm whether a reversal is genuine as part of a broader analysis.
In essence, reversal bars cut through the noise of the markets to pinpoint areas of order where the smart money is entering or exiting positions. Plotting them makes these trading clues visually obvious.
How the Reversal Bar Indicator Works
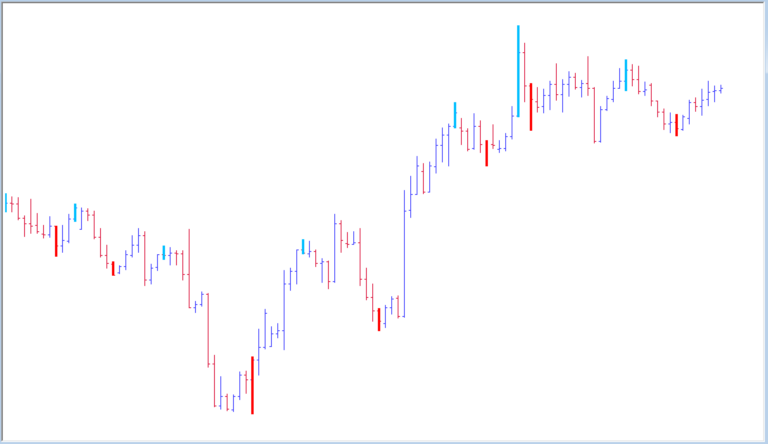
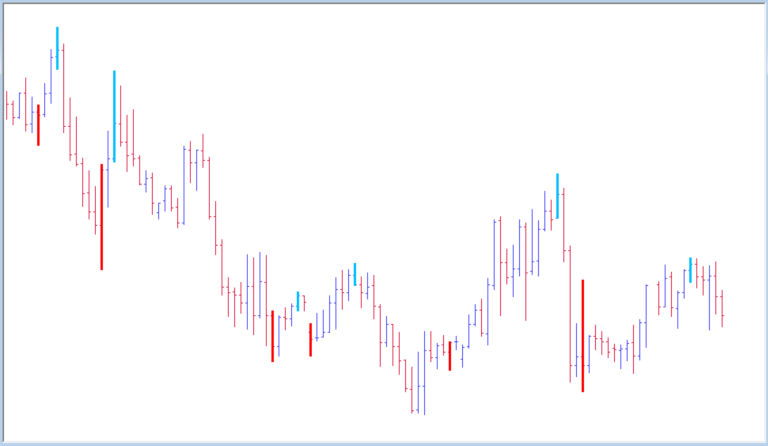
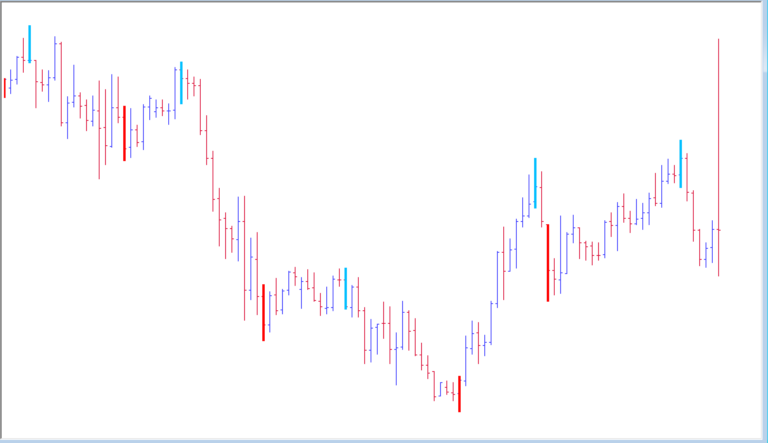
The reversal bar indicator scans the price history to identify past bars that possess the key attributes of a valid reversal bar. Each bar that fulfills the criteria is marked on the chart so traders can clearly see the exact reversal levels.
Indicator Logic
The indicator runs through the following logic to determine if a bar qualifies as a reversal bar:
The open and close are at opposite ends of the bar’s range
The bar has a large body to range ratio (typically over 60%)
The bar close is near the high or low of the bar range
The bar has relatively low overlap with the prior bar (configurable setting)
The bar meets minimum range and volume requirements (user configurable)
Any bars fulfilling these rules are plotted on the chart. The trader can then reference these levels for trades and support/resistance.
Key Parameters
The indicator has a few customizable parameters:
Body to Range %: The minimum body size as a percentage of the total bar range to qualify as a reversal bar. Larger bodies signal stronger conviction.
Overlap Limit: The maximum permitted overlap/gap between the reversal bar and prior bar. Lower overlap supports validity of the reversal signal.
Minimum Bar Range: The minimum price range required for a bar to qualify as a reversal bar. Filters out small bars and noise.
Volume Filter: Option to only mark bars with above average volume (where volume data exists) as reversal bars to confirm strength.
Left/Right Bars: Number of bars to the left and right of potential reversal bars to include in overlap and volume filters.
Optimizing Parameters
The indicator parameters can be adjusted to fine tune the reversal bars identified for a particular instrument and time frame. For instance, shorter time frames may require tighter range and overlap limits to reduce false signals.
The most significant parameters are the body to range ratio and permitted overlap. Traders will generally experiment with these two settings to find the optimal values for a given market.
Interpreting Common Reversal Bar Patterns
Reversal Bar Indicator
There are a few classical bar and candlestick patterns that produce clear reversal signals when they fulfill the reversal bar criteria:
Pin Bar
The pin bar has a large body with a small wick (tail) protruding in the opposite direction. It shows a sharp price rejection and reversal off a level. Pin bars are particularly significant when they form at swing points or Fibonacci levels.
Engulfing Bar
An engulfing pattern occurs when the body of the current bar fully encompasses or “engulfs” the body of the prior bar, signaling strong rejection. The larger the engulfing bar, the more significant the reversal signal.
Outside Bar
An outside bar forms when the current bar’s high and low exceeds the range of the prior bar, engulfing the previous bar’s range completely. It shows intense buying or selling pressure in the new direction.
Two Bar Reversal
This reversal pattern unfolds over two bars. The first bar continues the current trend, but the second bar breaks the low/high of the first bar and closes in the opposite direction, constituting the reversal bar.


