
📸 Gallery
RSI Divergence Indicator
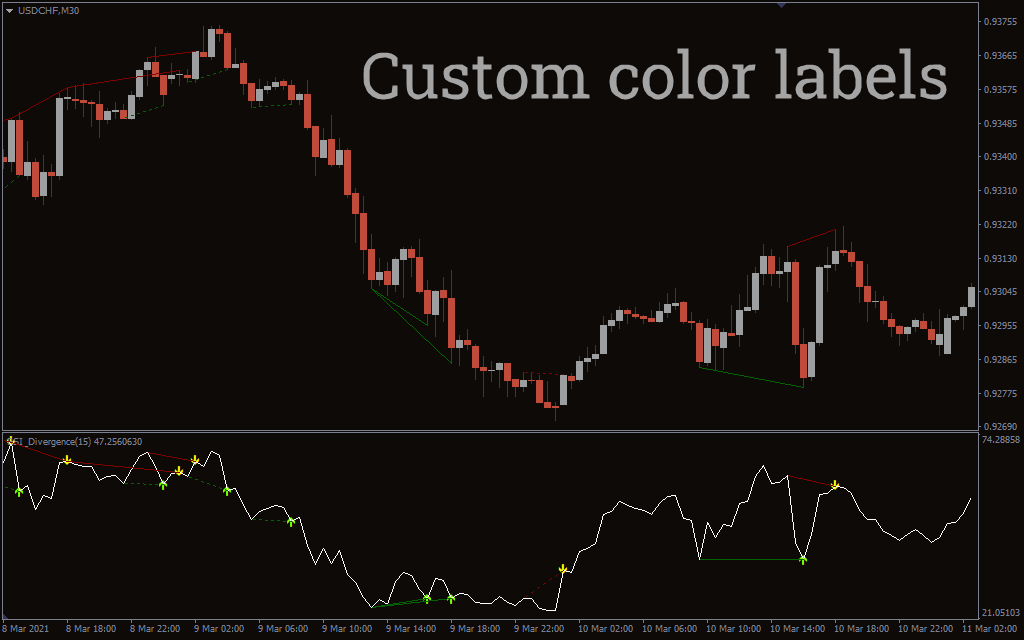
Combine the standard RSI indicator with divergences. Evaluate oversold and overbought conditions. Accurate BUY/SELL Signals. Free Download.
CATEGORIES: MT4, SIGNAL, LEVELS
Updated on: 26.11.2023
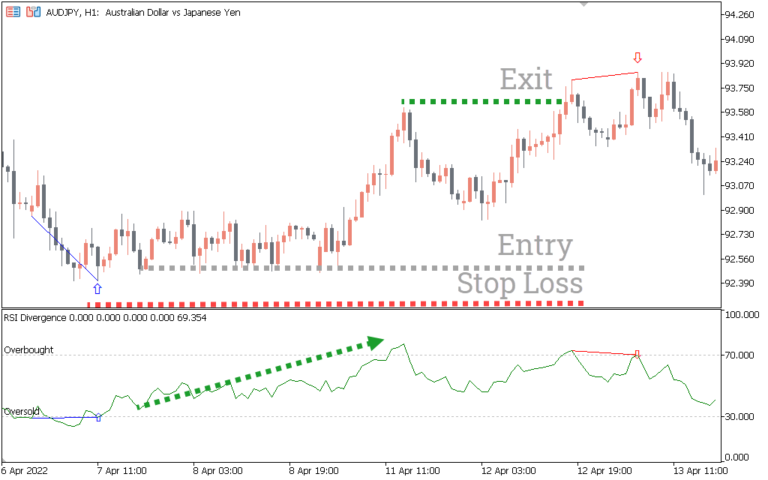
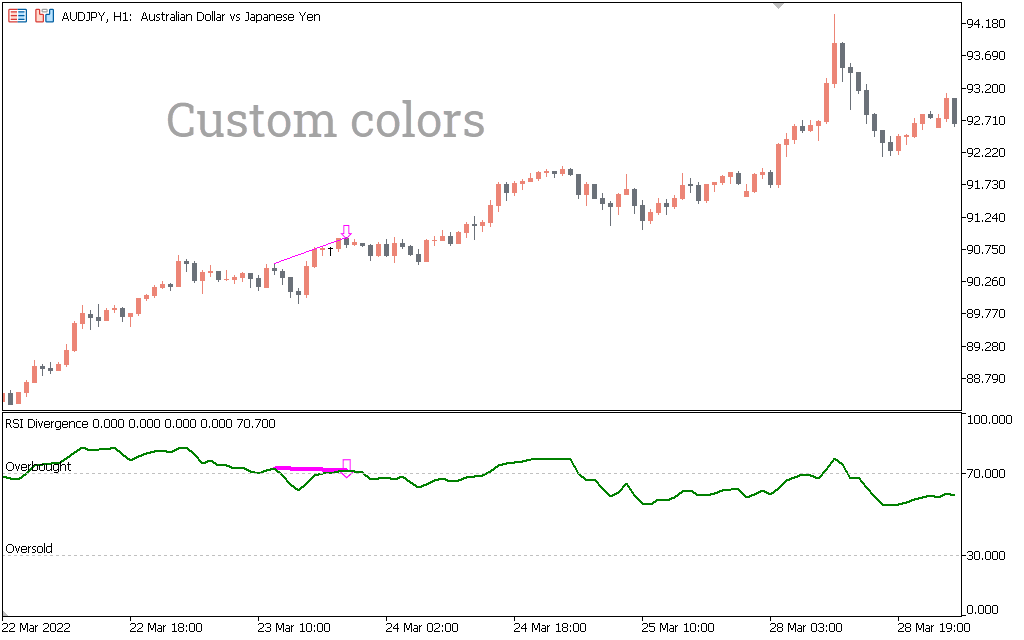
When price action and the RSI indicator are no longer reflecting the same momentum, an RSI divergence indicator signal traders.
The RSI (Relative Strength Index) is a momentum indicator that evaluates price change to identify overbought or oversold market conditions.
It has a scale from 0 to 100. When the Relative Strength Index drops below 30, the market is considered oversold. If the Index value exceeds 70, the market is deemed overbought.
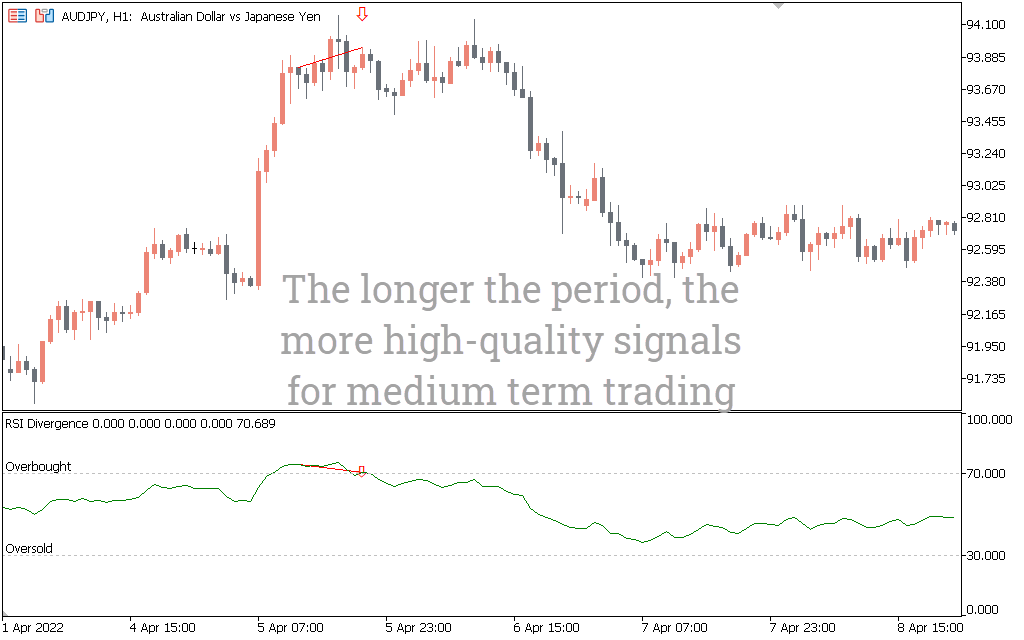
The lack of signals is one of the major issues experienced when employing an indicator. This indicator hardly reaches the overbought and oversold levels.
To counter this problem, you need divergence from the standard Indicator.
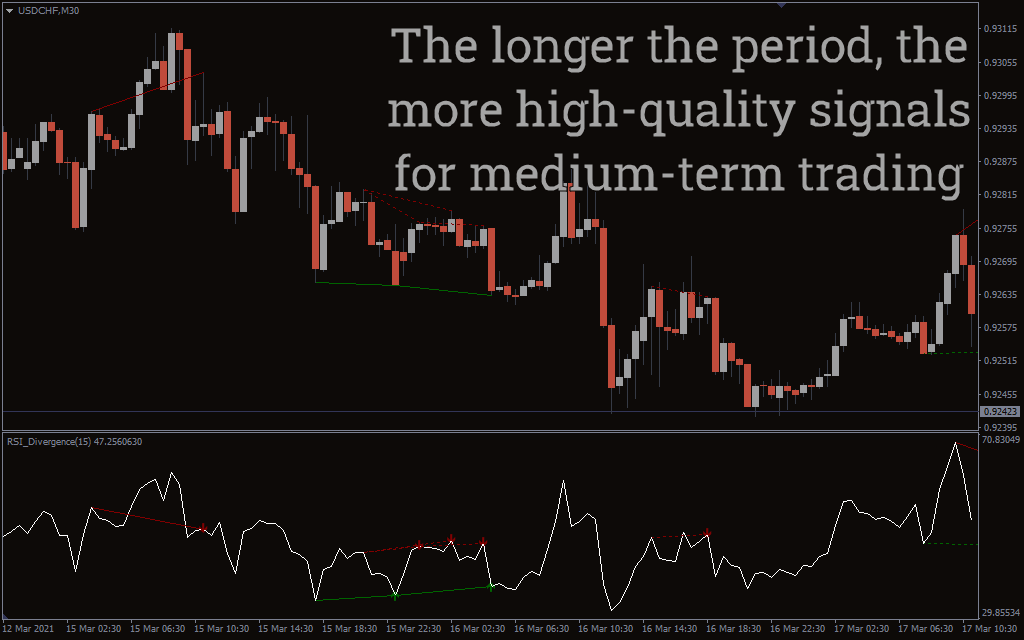
Divergence can assist you in determining when the market is likely to resume its trend following a pullback.
If a chart exhibits an RSI divergence, the relative strength index on the chart produces lower highs. This happens when the price makes higher highs. On the other hand, when the price makes new lower lows, the indicator shows higher lows.


Save time withd software.
Related products.

$0

$0

$0