Savior Colors Indicator - Advanced Cyclical Analysis Tool
🌌 "Master Market Cycles - Predict with Precision!"
📌 Overview
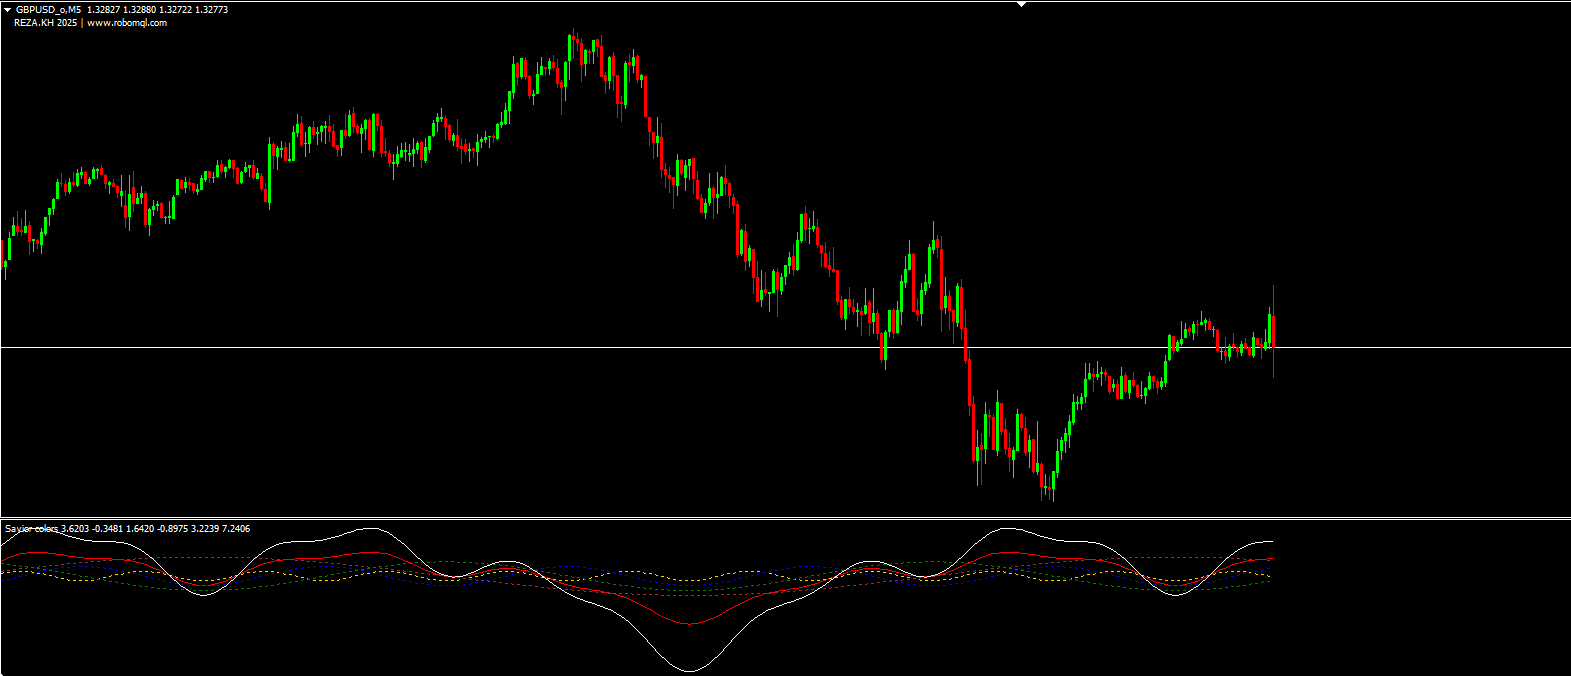
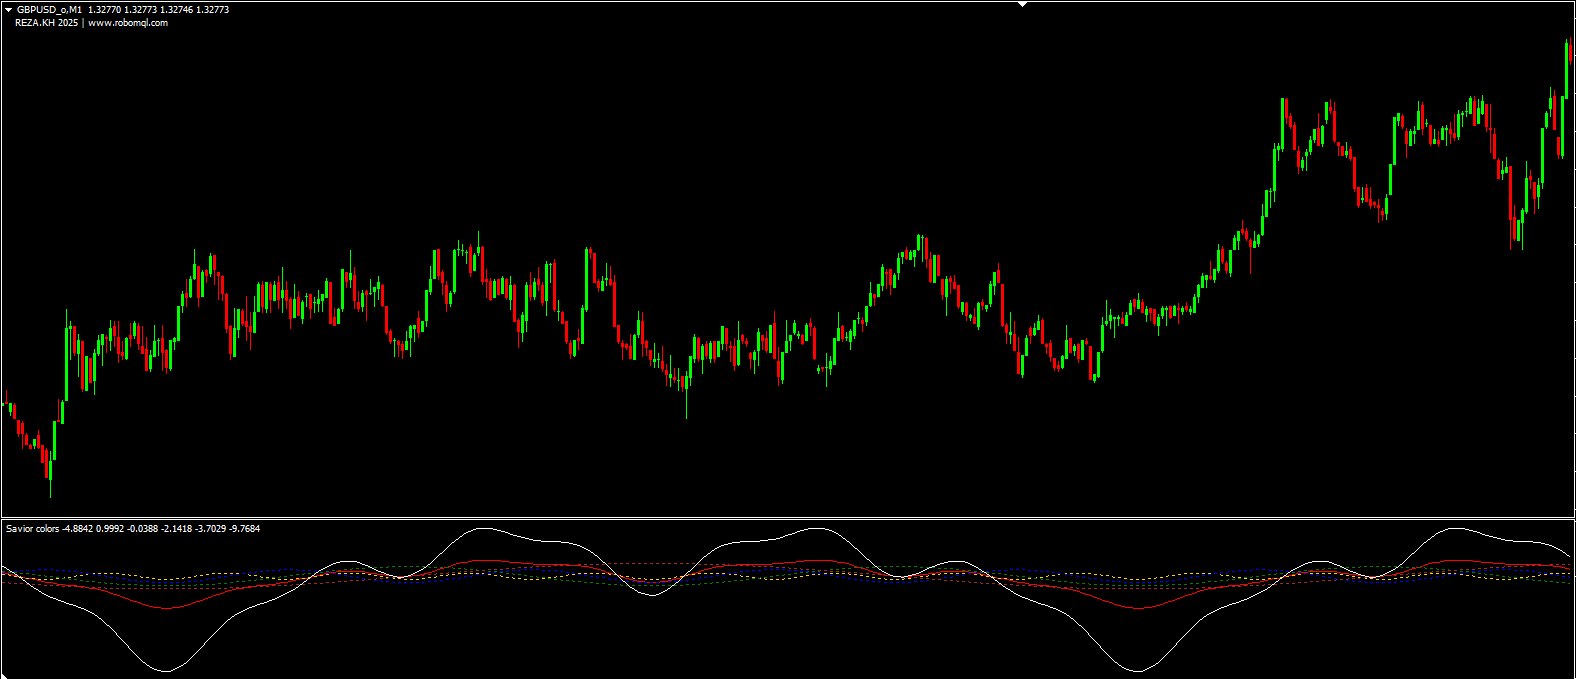
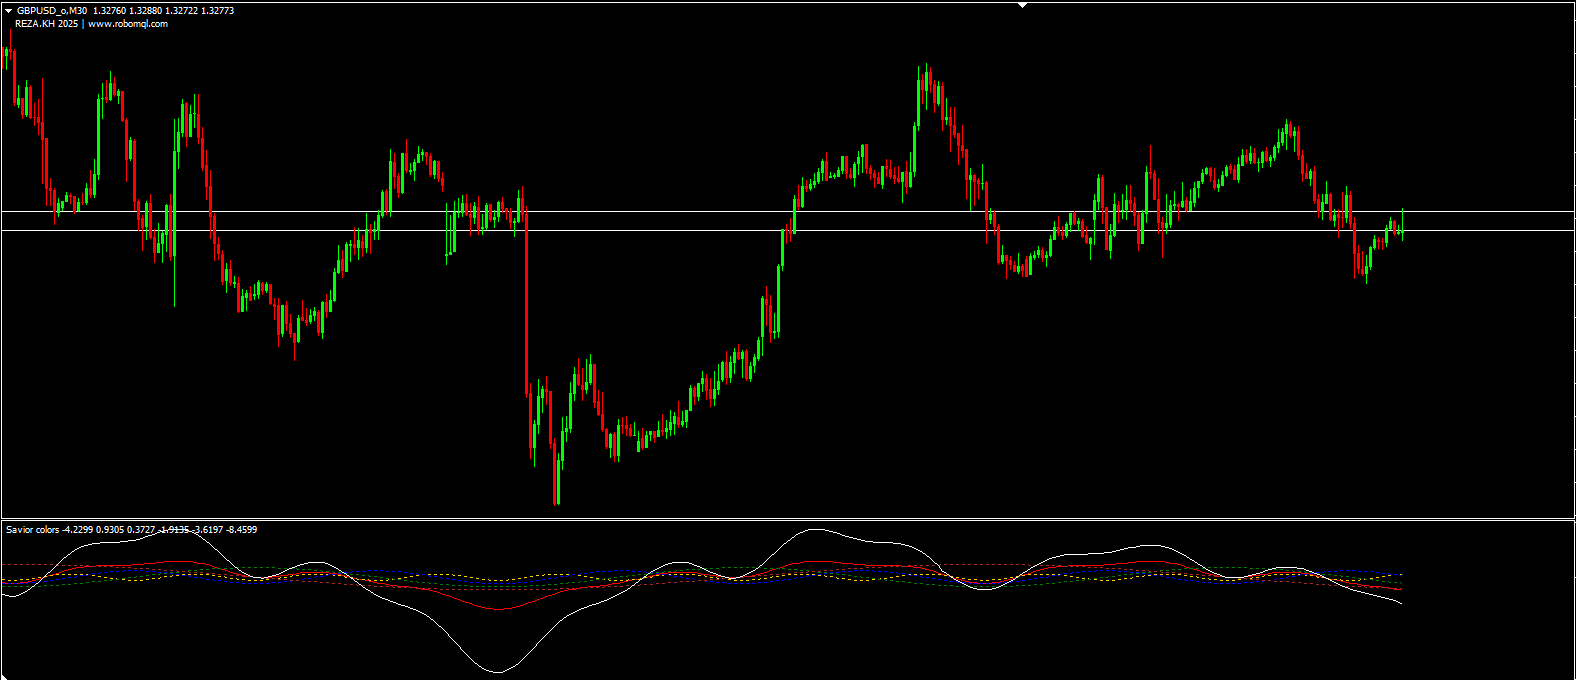
The Savior Colors Indicator is a sophisticated technical analysis tool that combines Hurst Cycle Theory with multiple harmonic wave patterns to identify market cycles and potential turning points. This MT4 indicator plots six distinct waves in separate colors, providing traders with a comprehensive view of market rhythms across different timeframes.
🔧 How It Works
The indicator applies a complex mathematical model based on sine wave harmonics:
Generates 4 harmonic waves:
w1: Fast cycle (8x frequency)
w2: Medium cycle (4x frequency)
w3: User-adjustable cycle (2x frequency)
w4: Slow cycle (base frequency)
Combines waves to create:
Cycle Line: Composite of all waves (Red)
Hurst Cycle: Smoothed composite with trend adjustment (White)
Calculates cyclical extremes using:
Wave amplitude normalization
Trend coefficient adjustment
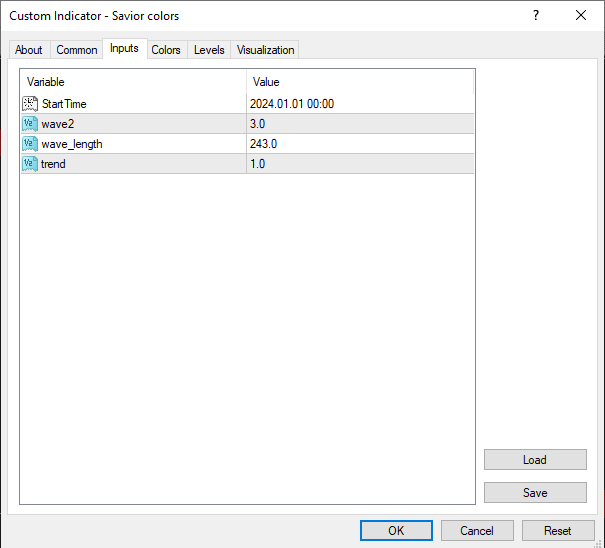
⚙️ Indicator Settings
Core Parameters
ParameterDescriptionRecommended Value
StartTimeAnalysis start dateRecent major swing point
wave2Wave 3 amplitude multiplier3 (default)
wave_lengthBase cycle length243 bars (default)
trendTrend direction filter1 (bullish), -1 (bearish)
Advanced Settings
ParameterFunction
phaseWave phase adjustment (-90 default)
strStrength coefficient (1 default)
koefNormalization factor (486 default)
📈 Trading Strategies
✅ Cycle Identification
Red Cycle Line: Composite wave showing overall market rhythm
White Hurst Cycle: Smoothed version for clearer signals
✅ Turning Points
Watch for wave convergence where all colored lines meet
Extreme divergences between waves signal potential reversals
✅ Multi-Timeframe Confirmation
Use shorter wave_length for intraday trading
Longer wave_length for swing/position trading
🔍 Unique Features
✔ Multi-wave analysis - 4 harmonic waves + 2 composite waves
✔ Customizable cycles - Adjust to any market's rhythm
✔ Visual clarity - Color-coded for easy interpretation
✔ Mathematically precise - Based on sine wave harmonics
📢 Final Words
"From chaos comes order - trade the cycles, not the noise!"
The Savior Colors Indicator provides traders with a powerful framework for understanding and capitalizing on market cycles across all timeframes.
Happy Trading! 🚀
— REZA.KH 2025 | www.robomql.com
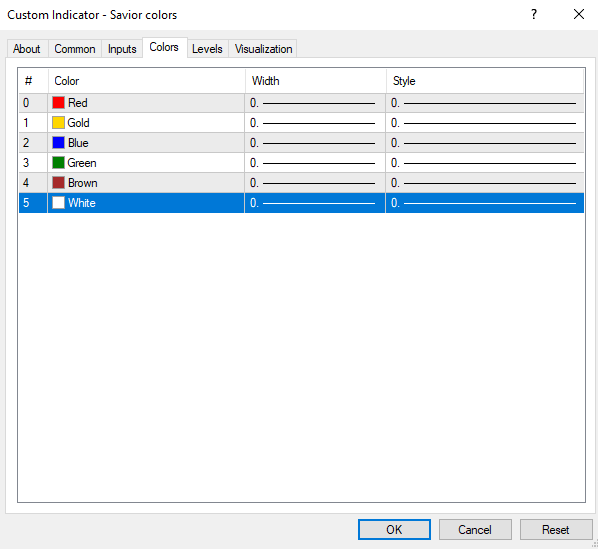
Appendix: Wave Color Guide
Red: Composite Cycle Line
Gold: w1 (Fastest cycle)
Blue: w2
Green: w3
Brown: w4 (Slowest cycle)
White: Hurst Cycle (Smoothed composite)