
Shoter Indicator - Detailed Explanation
This is a custom MetaTrader indicator called "Shoter Indicator" that identifies potential trading opportunities based on breakouts of trend lines drawn from ZigZag pattern points.
Indicator Components
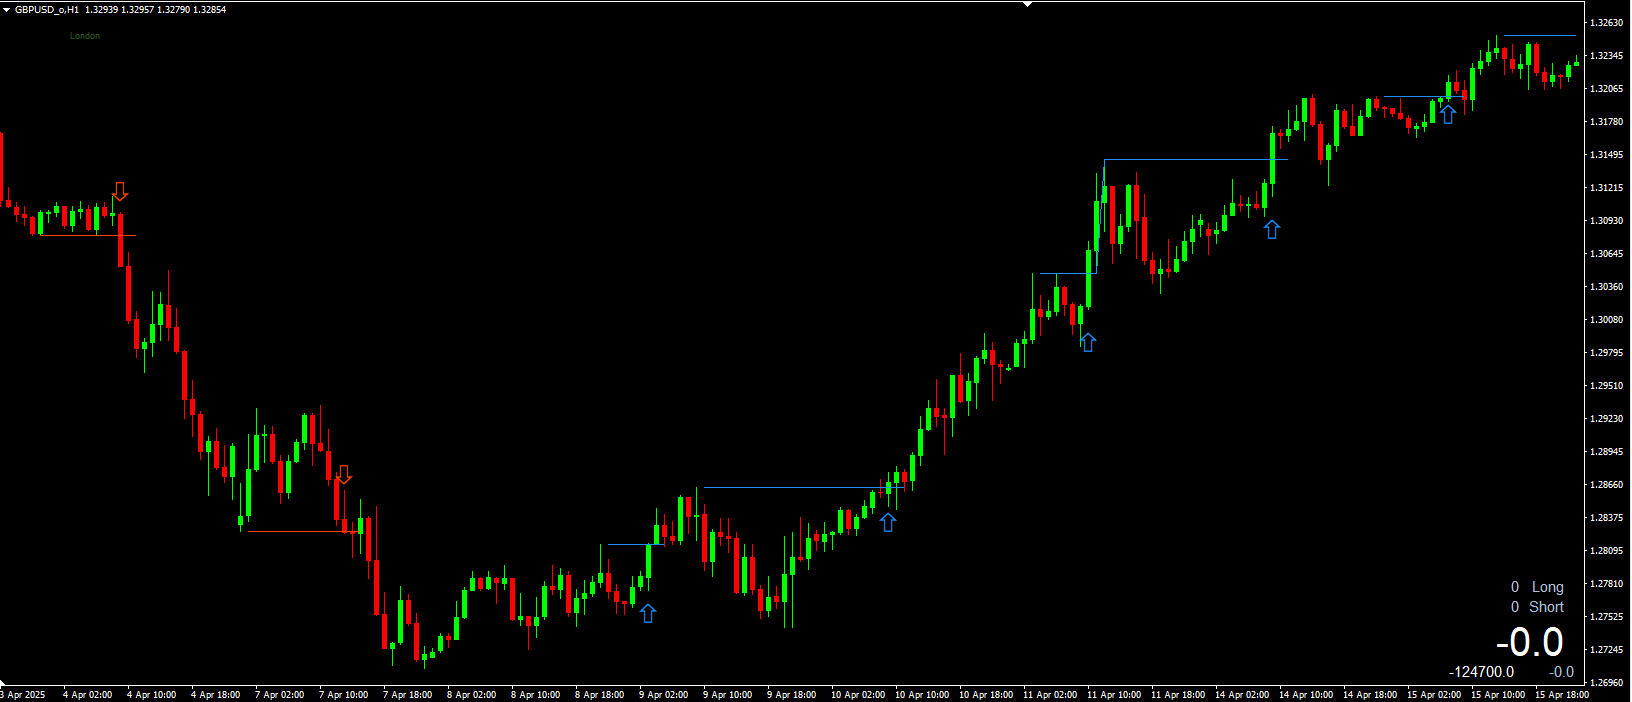
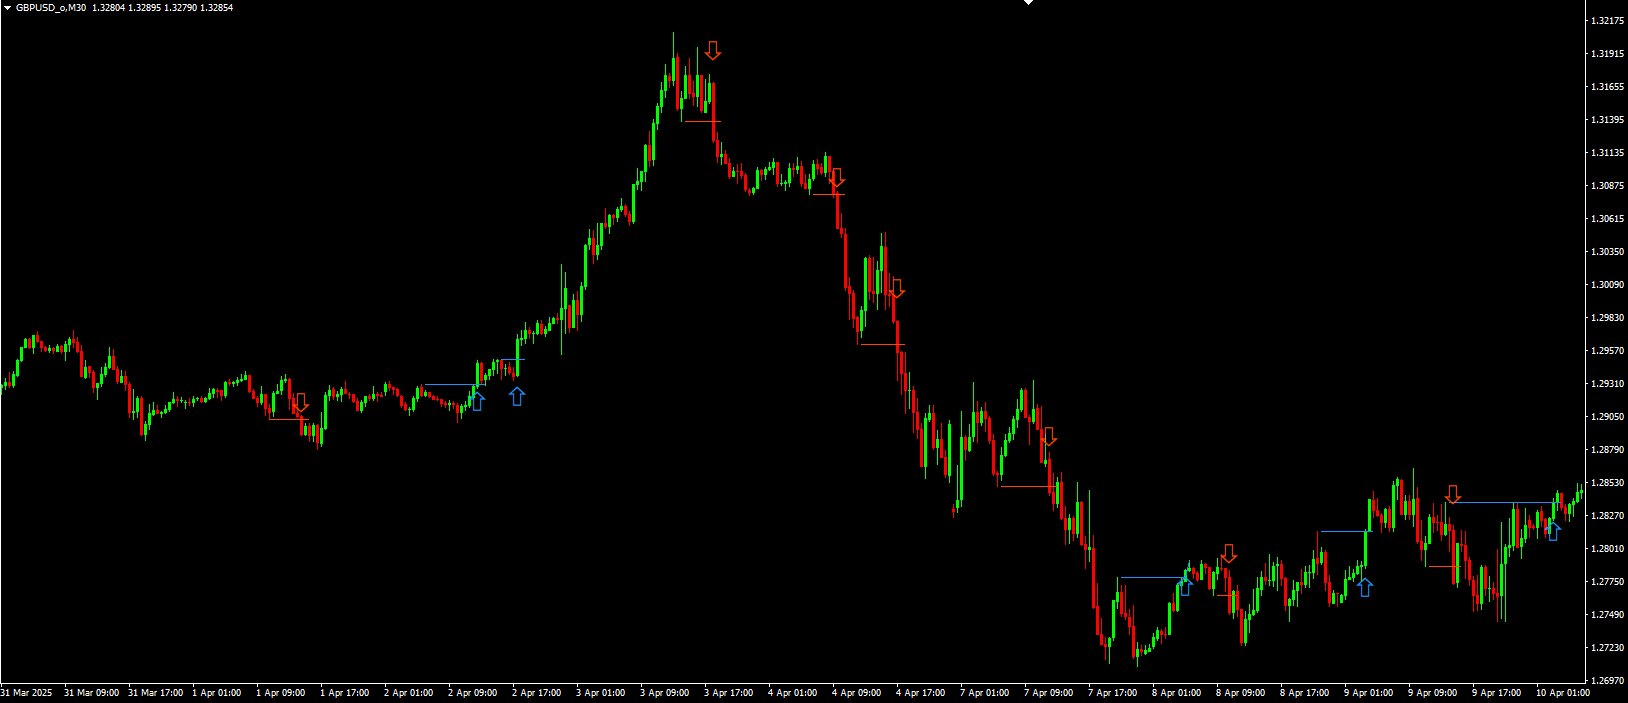
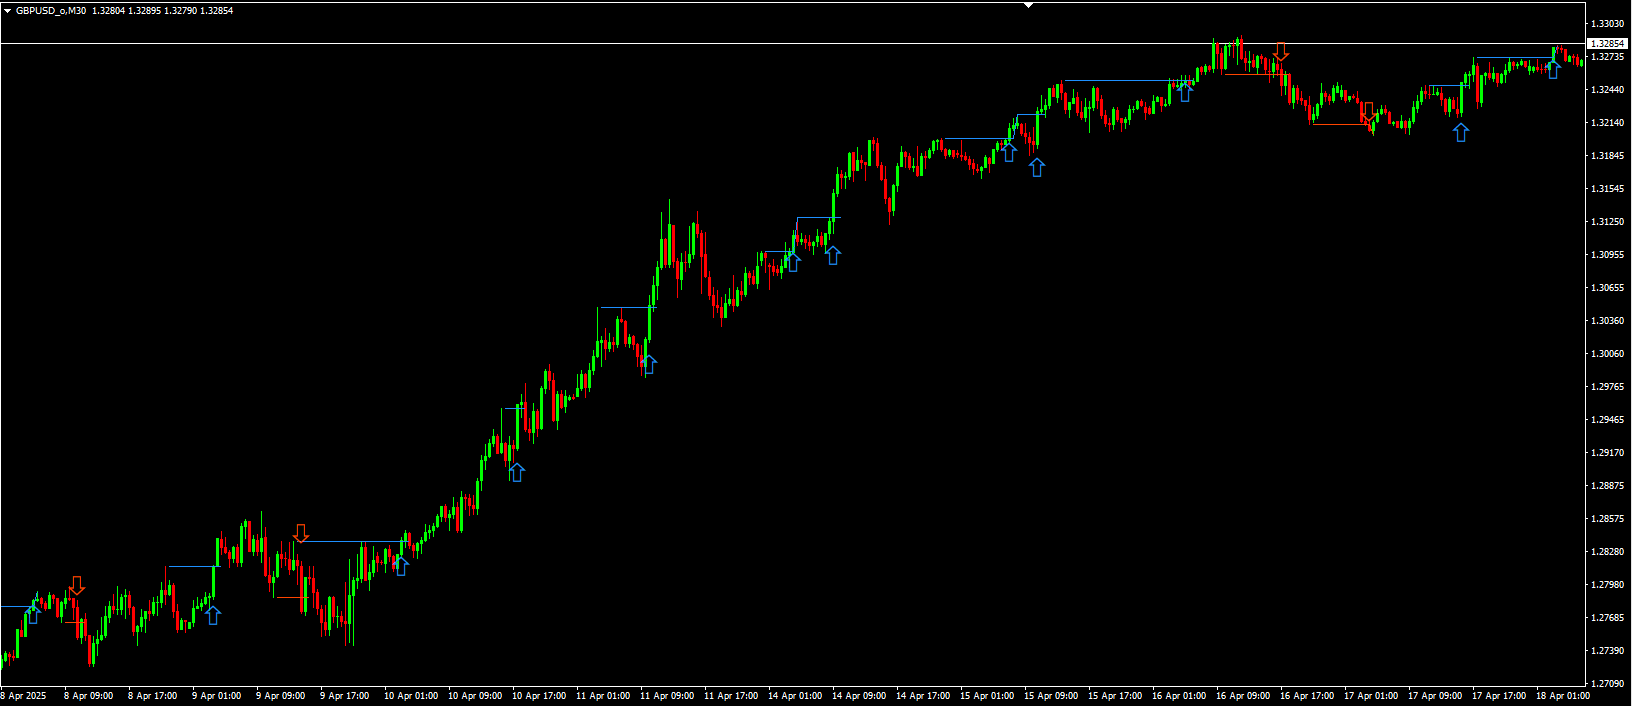
Visual Elements:
UpperLine (DodgerBlue): Drawn at ZigZag highs
LowerLine (OrangeRed): Drawn at ZigZag lows
BullDot (Goldenrod): Marks significant points in bullish setups (1-2-3 pattern points)
BearDot (CornflowerBlue): Marks significant points in bearish setups (1-2-3 pattern points)
BuyArrow (DodgerBlue): Signals bullish breakouts (up arrow)
SellArrow (OrangeRed): Signals bearish breakouts (down arrow)
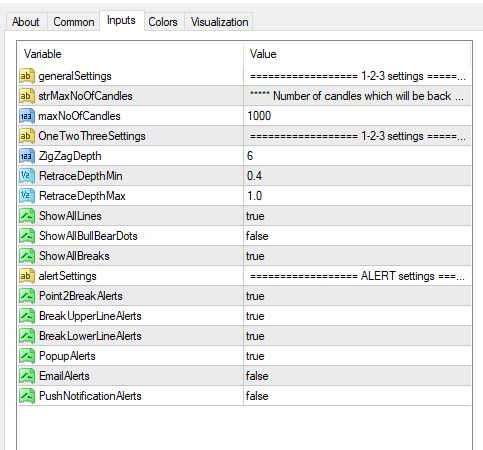
Input Parameters:
General Settings:
maxNoOfCandles: Limits how many candles to calculate (0=all visible)
1-2-3 Pattern Settings:
ZigZagDepth: Depth parameter for the ZigZag indicator
RetraceDepthMin/Max: Minimum/maximum retracement levels for valid patterns
ShowAllLines: Toggles display of all trend lines
ShowAllBullBearDots: Toggles display of all pattern points
ShowAllBreaks: Toggles display of all breakout signals (not just 1-2-3 patterns)
Alert Settings:
Three types of alerts can be enabled separately:
Point2BreakAlerts: For 1-2-3 pattern breakouts
BreakUpperLineAlerts: For any upper trend line break
BreakLowerLineAlerts: For any lower trend line break
Three delivery methods:
PopupAlerts
EmailAlerts
PushNotificationAlerts
How It Works
ZigZag Detection: The indicator first identifies peaks and troughs using the built-in ZigZag indicator.
Trend Line Drawing:
Upper lines connect ZigZag highs
Lower lines connect ZigZag lows
Pattern Recognition:
For bullish setups, it looks for:
A low (point 1)
A higher high (point 2)
A higher low (point 3)
Then watches for a breakout above point 2
For bearish setups, it looks for:
A high (point 1)
A lower low (point 2)
A lower high (point 3)
Then watches for a breakout below point 2
Breakout Conditions:
The retracement between points 2-3 must be between RetraceDepthMin and RetraceDepthMax
Price must close beyond the trend line (point 2 level)
Signal Generation:
Places arrows at breakout points
Marks the 1-2-3 points with dots
Can trigger alerts when new signals appear
Cleanup:
Removes unnecessary trend lines after breakouts occur
Converts zero values to EMPTY_VALUE for cleaner display
Alert Messages
When a breakout occurs, the indicator can generate alerts with the format:
"[Symbol] [Timeframe] [buy/sell]!"
For example: "EURUSD M15 buy!"
Color Scheme
The color choices serve specific purposes:
Blue (DodgerBlue) for bullish elements (upper lines, buy arrows)
Red (OrangeRed) for bearish elements (lower lines, sell arrows)
Goldenrod for bullish pattern points
CornflowerBlue for bearish pattern points