
📸 Gallery
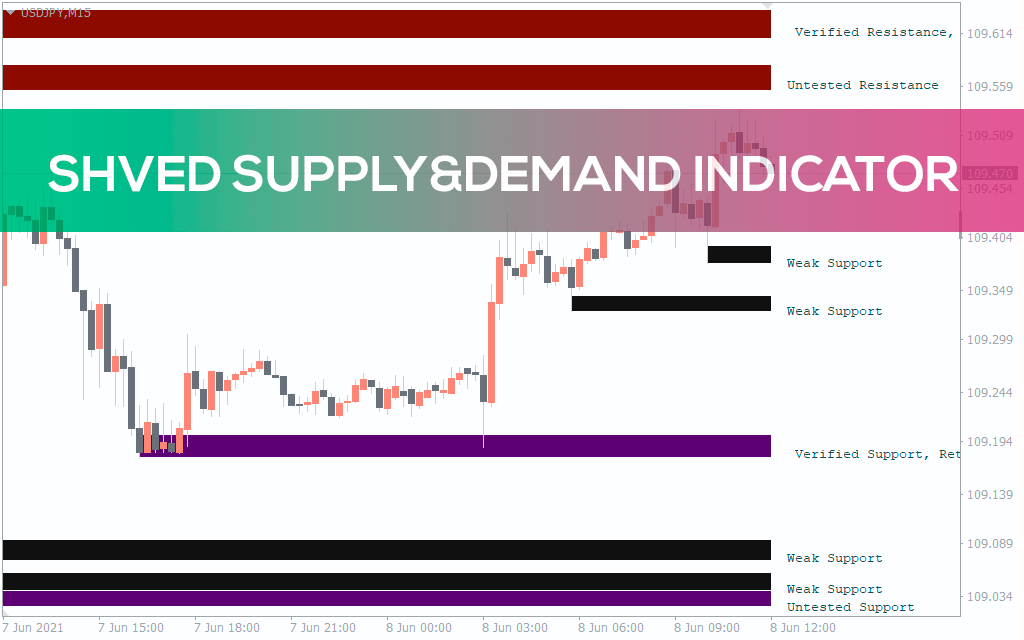
Shved Supply & Demand Indicator
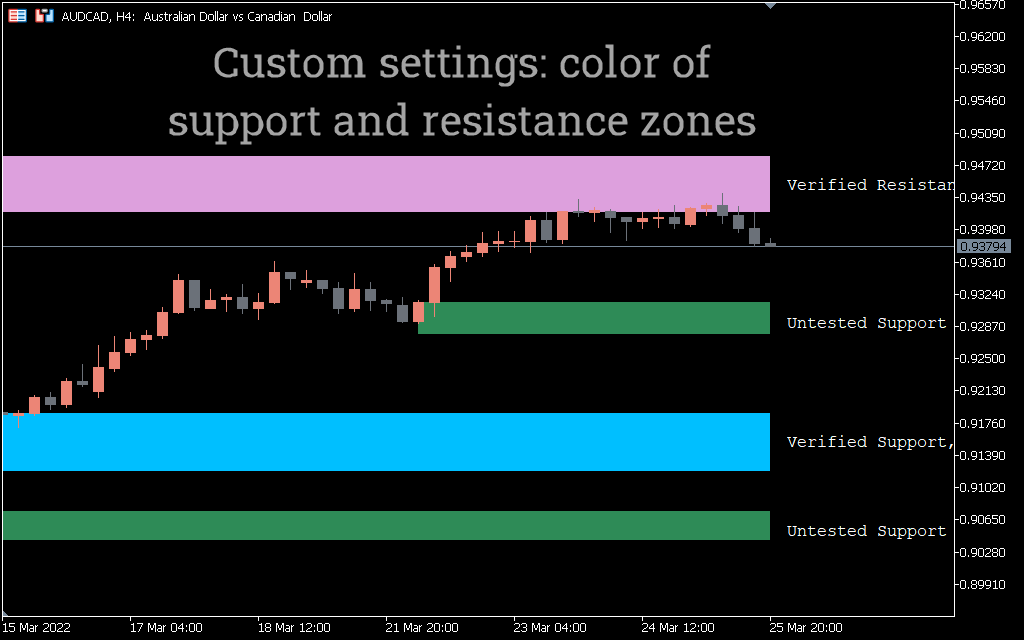
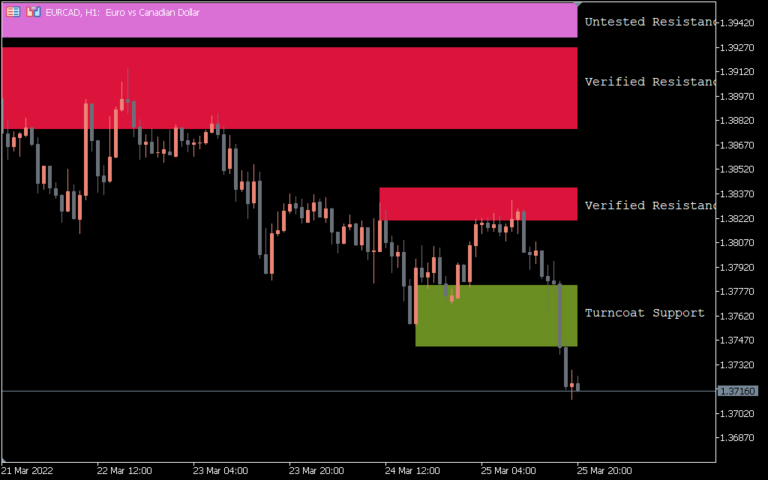
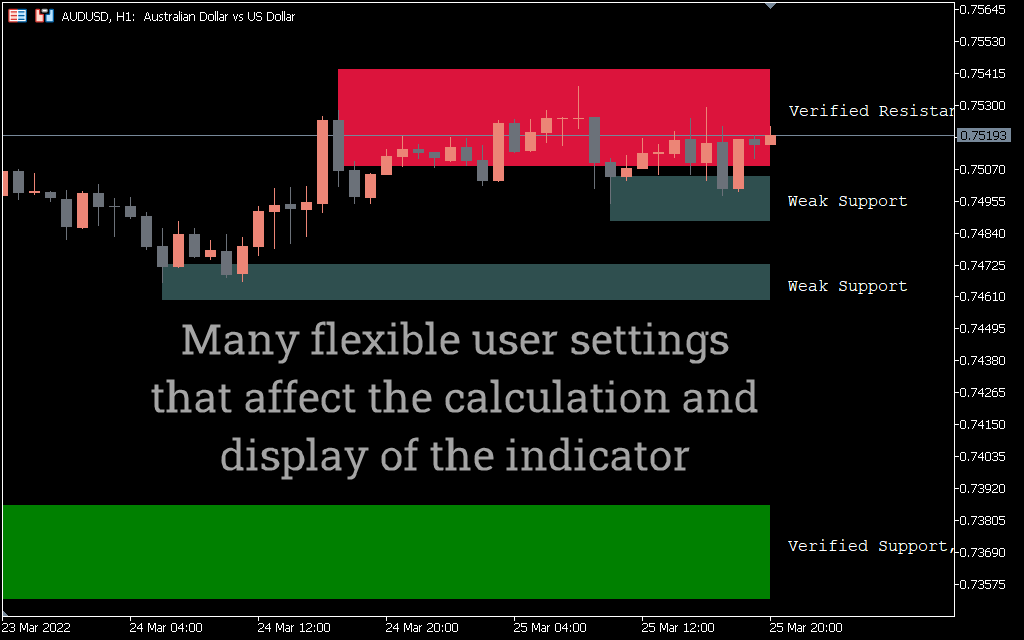
The indicator automatically plots supply and demand zones on the chart. Trading activity of Forex market participants is higher next to these levels. This allows you to identify potentially profitable points for trading.
CATEGORIES: MT4, LEVELS, INFORMATIONAL
Updated on: 05.11.2023
You most likely know that the ever-changing ratio of buyers and sellers is behind all the price movements in the Forex market.
By default, the MT4 terminal doesn’t have the indicator that can highlight the zones where key changes in this ratio take place.This is why we suggest you to check out this free Shved Supply & Demand indicator developed for spotting and automatic drawing levels of that sort.
Contents:
1. Description Shved Supply & Demand indicator.
2. What kind of zones does the Shved Supply & Demand plot?
3. Examples of how to use the indicator
Promotion:
1. Description Shved Supply & Demand Indicator
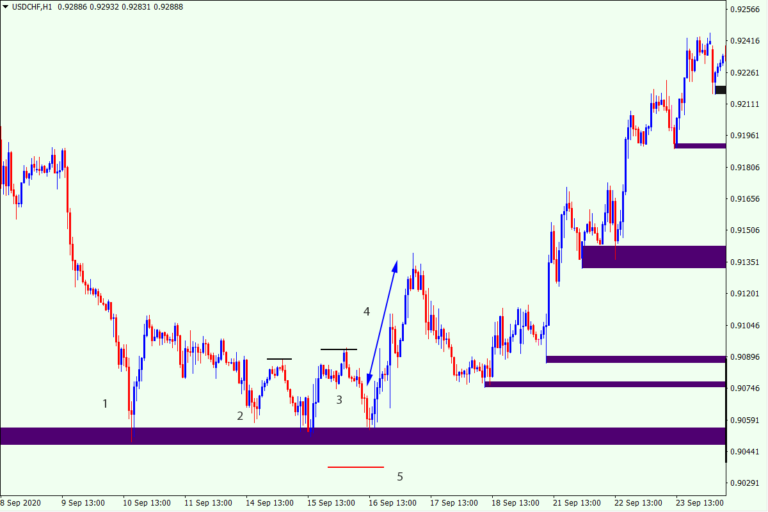
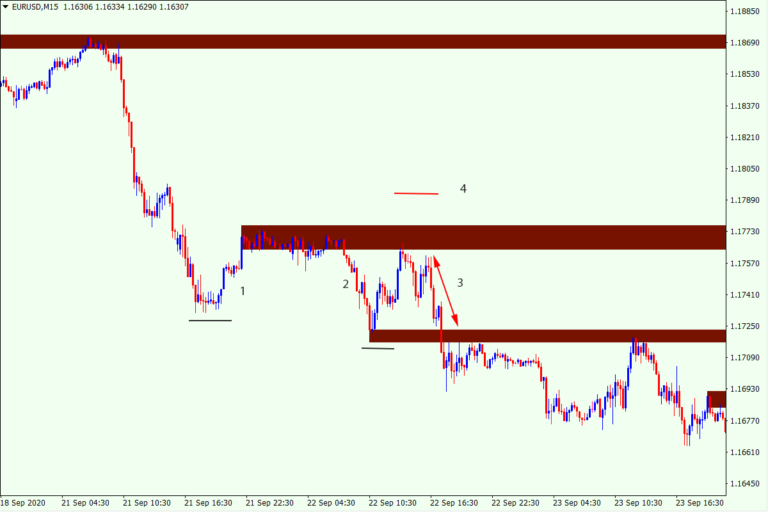
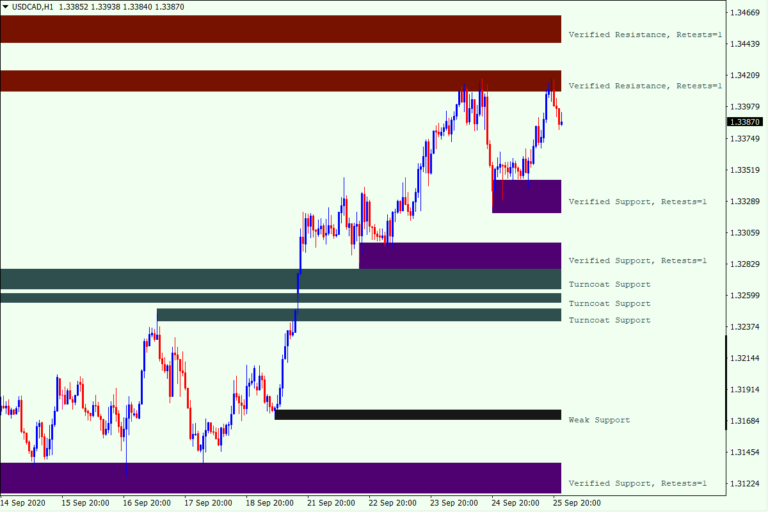
Zones of supply and demand are the levels, near which the heightened Forex market activity could be previously seen.
These values are interesting to us because the repeated price interaction with them makes it possible to determine potentially profitable points to enter trades.
Levels are drawn based on those supply and demand zones, from which there has already been a fairly strong targeted movement.
Height of the zones depends on the price activity near them. If the levels have repeatedly sparked the interest of traders, and the price went up/down after responding to them, the height will be visually greater.
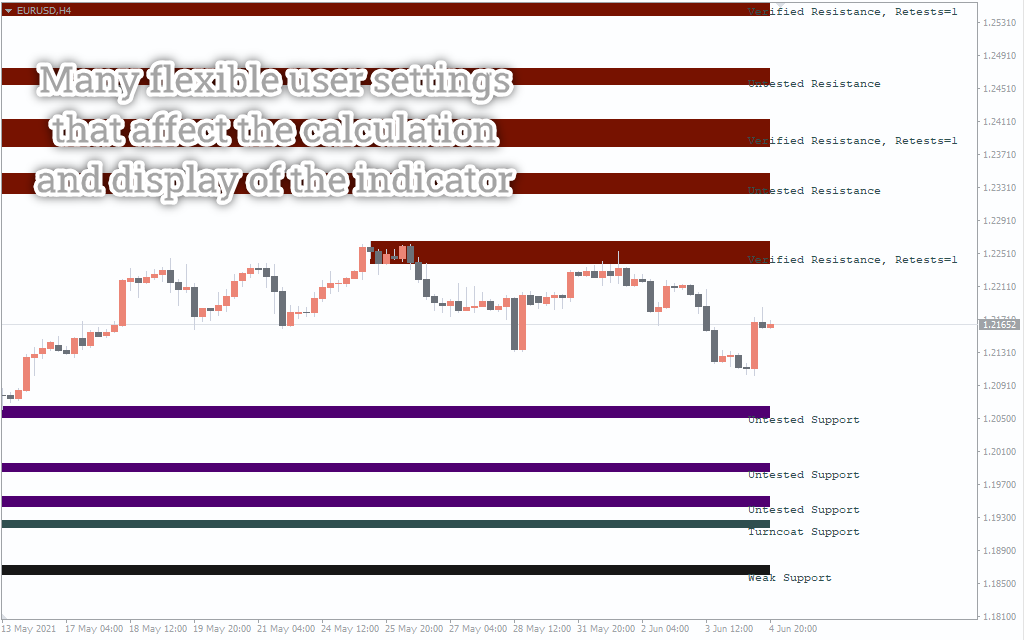
For convenience, all the chart formations have a short text description, so you won’t have a problem understanding what the highlighted level means.
Like most Forex market indicators, Shved Supply and Demand gives more valid signals on higher timeframes. This is because there is a fair amount of market noise at low timeframes.
You should also keep in mind that the more often the price has tested supply and demand zones, the more actual they can be.


Save time withd software.
Related products.

$0

$0

$0