

×
![]()
Sideways Detector MT4 Forex Indicator
How to determine breakout trading signals by using Sideways Detector in MT4
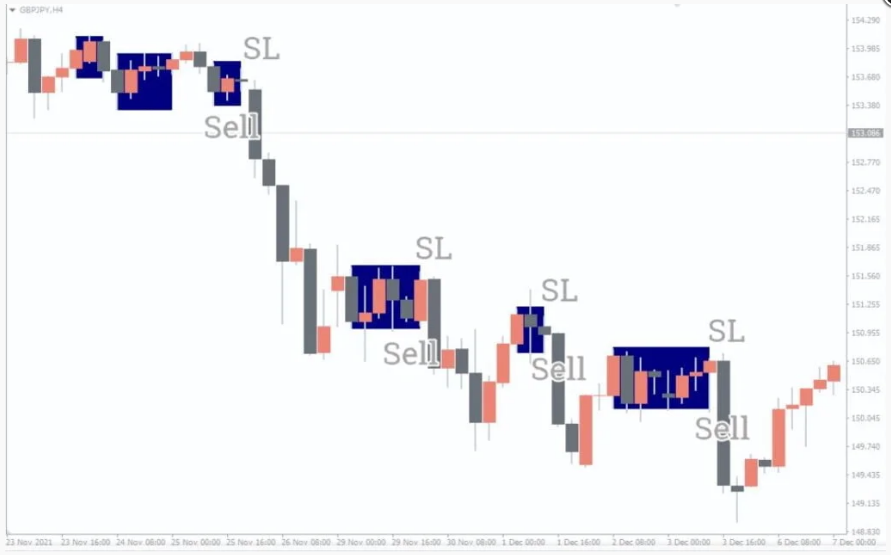
The Sideways Detector constantly monitors the highs and lows of the price candles for spot-flat market trends. It highlights the areas using a blue rectangle whenever the price initiates moving within a shorter range. It indicates the price is flipping within the rectangle and has yet to decide its future trend.
Depending on the market sentiment, the price may break out of the sideways range either way. , Activate buy orders when the price turns above the blue box, plotting a bullish breakout. And go for sell entries when the price makes a bearish breakout by moving below the box’s low.
Sometimes you may encounter false price breaks at the edge of the rectangle, causing losing trades. Although, you can still improve your winning rate by considering entries plotted only within the current trend direction.
For instance, look for bullish breakouts only for placing buy orders during uptrend market conditions. Moving averages, MACD, and high-low methods are the most effective tools for identifying market trends. Besides, you may add pivots, support/resistance, and trend lines to spot strong price breakouts.
Conclusion
The Sideways Detector is an easy-to-use MT4 indicator that offers tremendous technical advantages, especially for beginners with less trading experience. The primary goal of detecting a flat price trend is anticipating the possible price breakout levels. In that regard, Sideways Detector highlights the price range during sidelined market periods. Moreover, it suits multi timeframes of the Metatrader platform, allowing you to look for potential price breakouts in MTF charts simultaneously.