📸 Gallery


Support And Resistance (Barry) Indicator
Introduction to Support and Resistance Indicators
Support and resistance play pivotal roles in the world of technical analysis, offering traders insights into potential price levels where the market might halt or reverse. Within this context, the Barry Support and Resistance indicator emerges as a valuable tool in identifying these critical zones.
Explaining Support and Resistance in Trading
In the realm of trading, support represents a price level where a downtrend is expected to pause due to a concentration of demand, preventing the price from falling further. Conversely, resistance signifies a price level where an uptrend could stall due to an abundance of supply, impeding further upward movement. These levels are instrumental in analyzing market dynamics and predicting potential price actions.
Overview of the Barry Support and Resistance Indicator
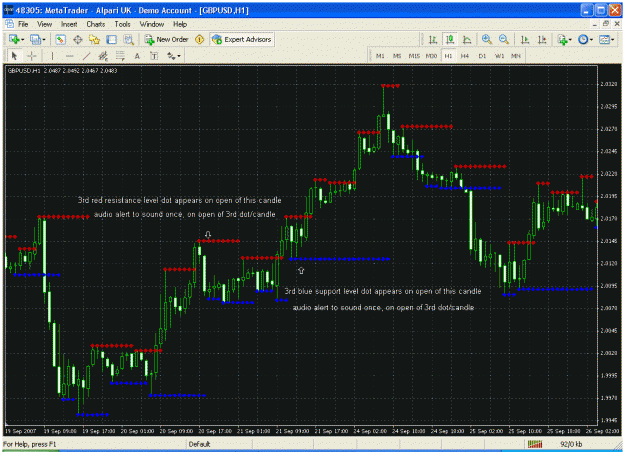
The Barry Support and Resistance indicator is designed to plot support and resistance levels based on recent price action. It stands out for its ability to visually present these crucial levels on the chart, aiding traders in decision-making processes.
Installing the Barry Support and Resistance Indicator
Installing the indicator on the MetaTrader 4 platform involves a straightforward process. Users can download the indicator file and place it in the appropriate directory within the MT4 platform. Once installed, traders can customize settings such as colors and line styles according to their preferences.


