

📸 Gallery
Support&Resistance Indicator
Automatic construction of the most relevant support and resistance zones in the forex market using the Support & Resistance indicator.
It is curious that by default there is no indicator in the MT5 terminal that would automatically build support and resistance levels. After all, these levels are one of the key elements of technical analysis, which is used by many traders. Automatic support & resistance indicator solves this problem.
Indicator description
The support and resistance indicator automatically displays important SR levels on the chart.
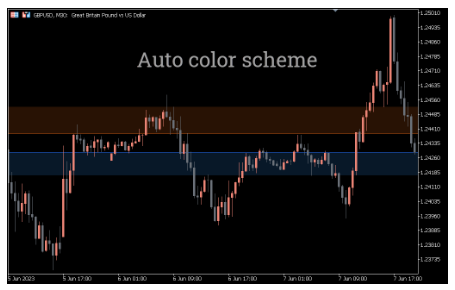
Resistance levels (zones) are shown on the chart in red, while support levels (zones) are shown in blue. Support levels indicate the possible interest of buyers when the price approaches them.
Resistance levels indicate the opposite – when the price approaches these levels, sellers may be interested.
Auto-drawing by the indicator of the actual levels of support and resistance allows you to save time and effort when analyzing the chart. This will certainly be a big plus for both professionals and novice traders.
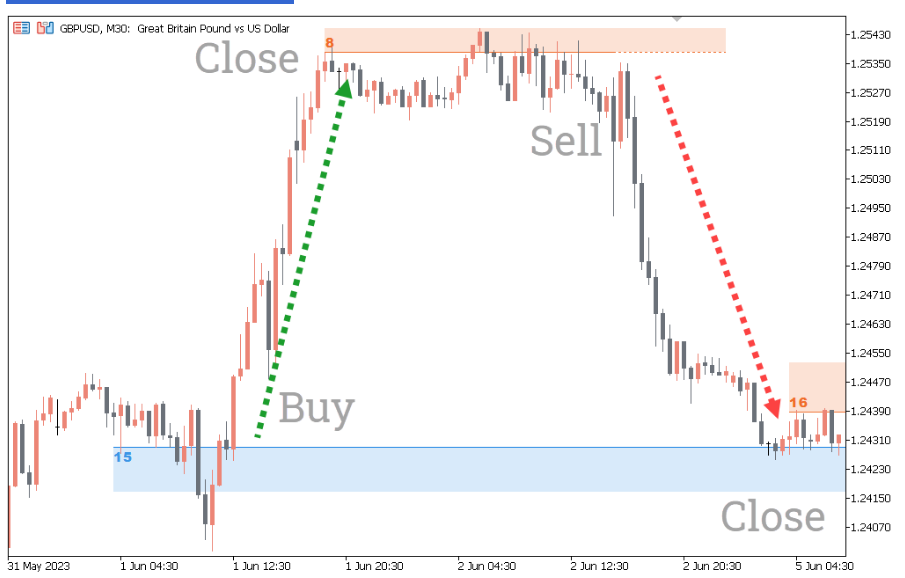
The levels of SR displayed by the indicator can serve as a guideline for placing orders when closing positions (stop loss and take profit). They also help to determine the signals for opening trades.
Indicator drawing technique
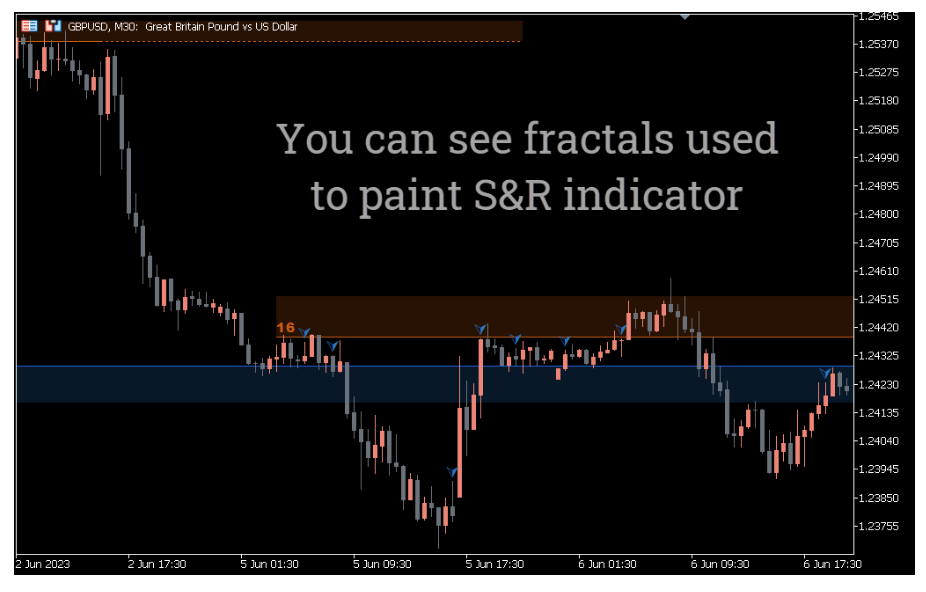
Support and resistance levels, as a rule, are built using market extremes – the so-called fractals. The standard set of indicators in the MT5 terminal contains the Fractals indicator. It displays these extremes.
The SR indicator already includes a fractal indicator. It builds SR levels based on the points where there were the most fractals.

Save time withd software.
Related products.

$0

$0

$0