
Swordsman Indicator - Complete Trading Guide
Indicator Overview
The Swordsman is a powerful trading indicator that identifies potential reversal points by analyzing price action patterns within specific time windows. It combines:
Price range analysis
Candlestick momentum detection
Visual rectangle markers
Buy/Sell arrow signals
How the Swordsman Indicator Works
Core Logic:
Time Window Analysis (22:00 GMT by default)
Scans a 12-candle period for dominant momentum (bullish/bearish)
Marks the high/low range with colored rectangles
Generates entry signals when momentum confirms
Signal Generation:
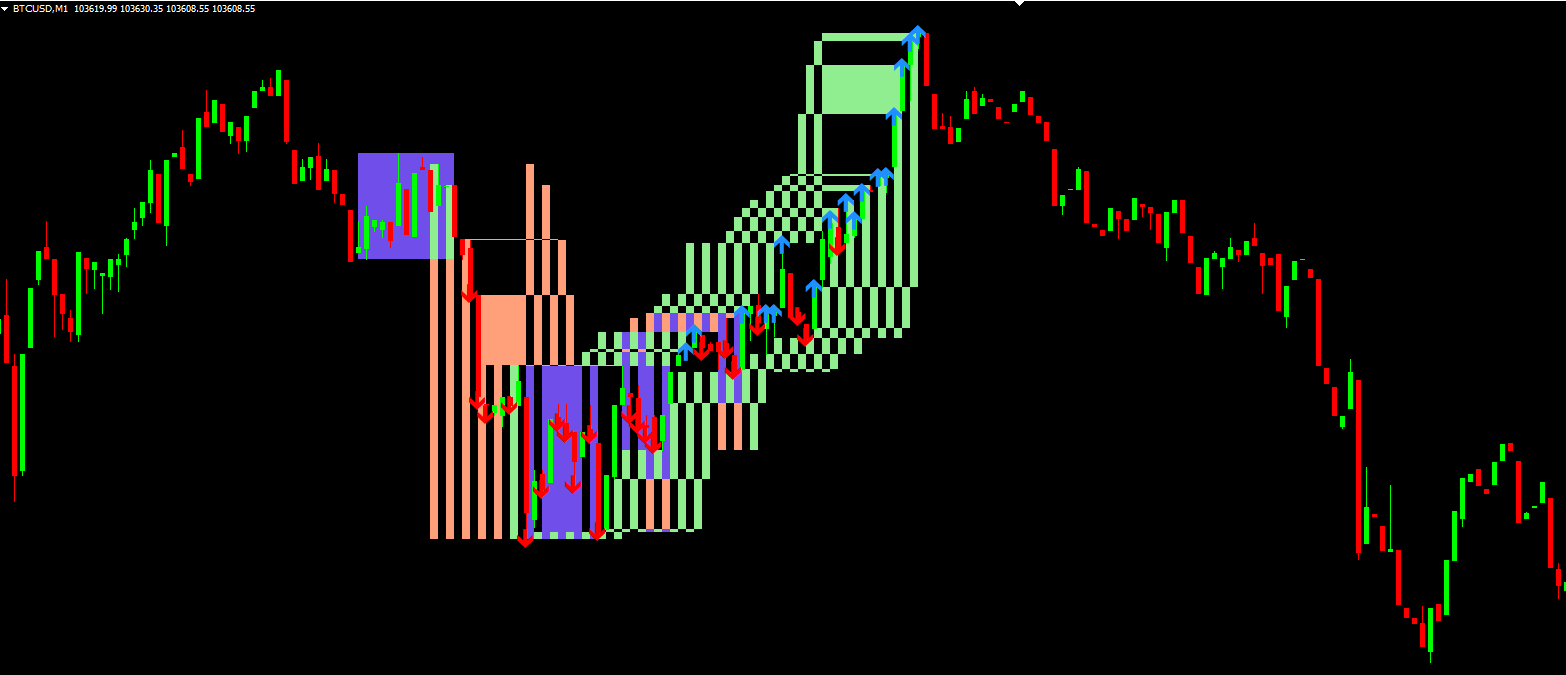
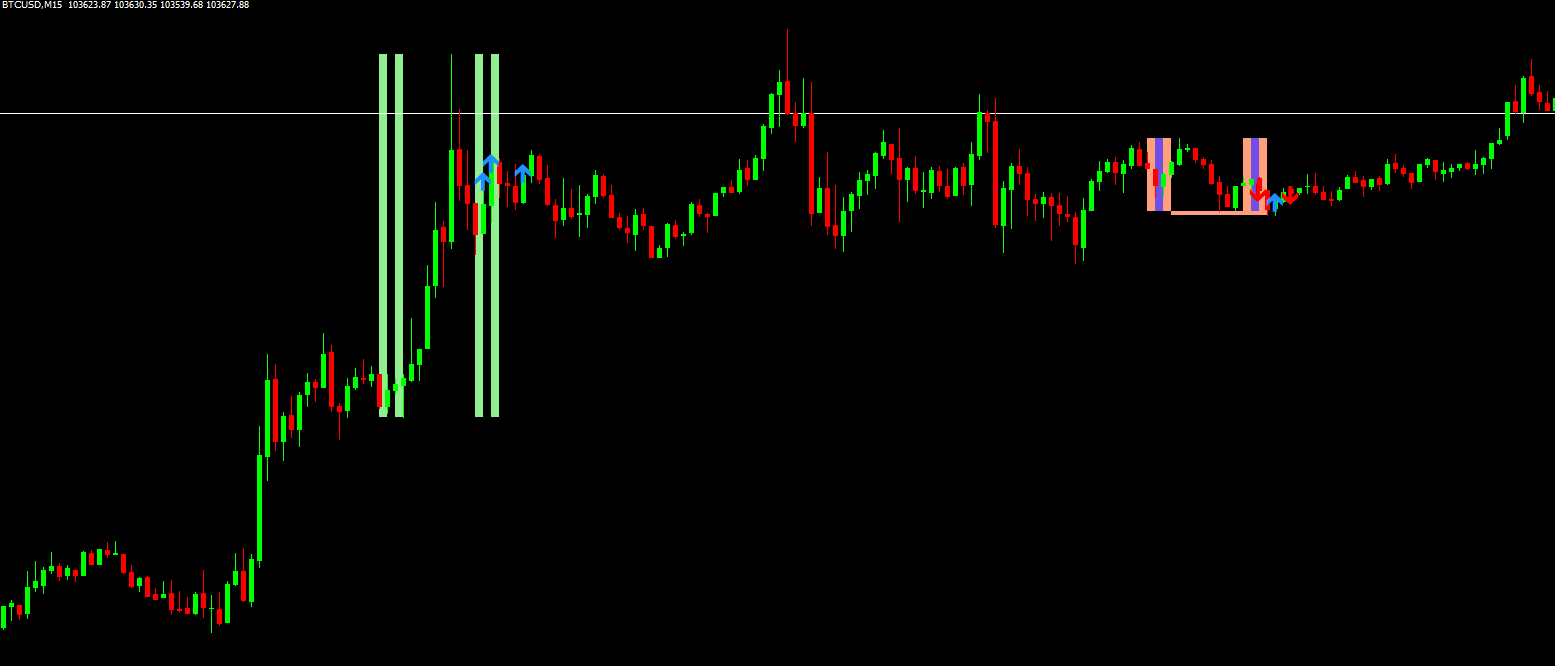
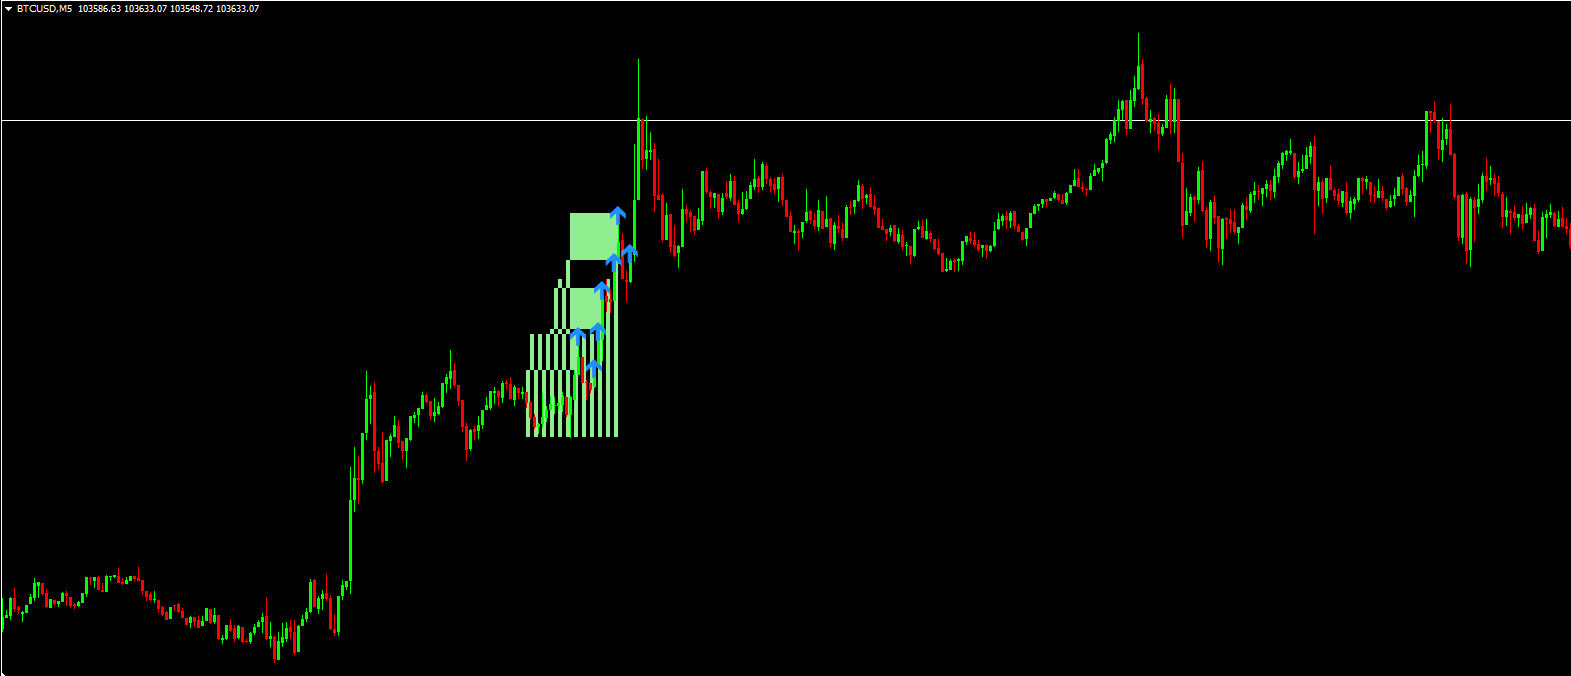
Blue Up Arrows: Appear when bullish momentum dominates
Red Down Arrows: Appear when bearish momentum dominates
Signals are placed at key breakout levels
Visual Elements:
Light Green Rectangles: Bullish zones
Light Salmon Rectangles: Bearish zones
Entry arrows appear slightly beyond the marked zones
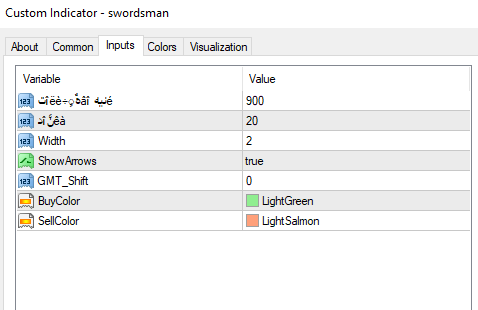
Optimal Settings
ParameterDescriptionRecommended Value
BarsCountLookback period500-1000 candles
دîنَّêàPrice offset for signals15-30 pips
WidthArrow thickness1-3
ShowArrowsToggle signal visibilityTrue
GMT_ShiftAdjust for your timezone-3 to +3
BuyColorBullish zone colorLightGreen
SellColorBearish zone colorLightSalmon
Trading Strategy
Best Timeframes:
H1 and H4 for swing trading
M15-M30 for day trading (with adjusted settings)
Entry Rules:
Long Positions:
When blue arrow appears above rectangle
Place stop loss below rectangle low
Target 1: 1.5x rectangle height
Target 2: 2x rectangle height
Short Positions:
When red arrow appears below rectangle
Place stop loss above rectangle high
Target 1: 1.5x rectangle height
Target 2: 2x rectangle height
Confirmation Tips:
Wait for candle close beyond rectangle
Combine with RSI (30/70 levels)
Look for volume spikes on breakouts
Slogan
"Precision Trading Like a Master Swordsman - Strike at the Perfect Moment!"
Pro Tips
Session Trading:
Works exceptionally well during London/New York overlap
Adjust GMT_Shift to match your trading session
Risk Management:
Never risk more than 2% per trade
Move to breakeven after 1.5x risk achieved
Filtering Signals:
Only trade arrows that align with higher timeframe trend
Avoid trading during news events
Customization:
For scalping: Reduce BarsCount to 200-300
For position trading: Increase to 1500+
Indicator Strengths
✓ Clear visual representation of trading zones
✓ Objective entry signals
✓ Adaptable to multiple timeframes
✓ Customizable colors for personal preference
Limitations
× May generate false signals in choppy markets
× Requires proper GMT adjustment
× Works best in trending conditions
Recommended Pairings:
Combine with 200 EMA for trend confirmation
Use with ATR for dynamic stop placement
Add Volume Profile for key level confirmation
Would you like me to suggest modifications to enhance this indicator's functionality? For example:
Adding alert functionality
Incorporating multi-timeframe analysis
Creating a dashboard version
Adding profit target lines