
The best daily data
The Best Daily Data Indicator - Comprehensive Explanation
Overview
The Best Daily Data indicator is a powerful multi-functional dashboard that provides traders with essential daily market information directly on their charts. This innovative tool combines price action analysis, volatility measurement, and trading session tracking in one comprehensive package.
Key Features & Benefits
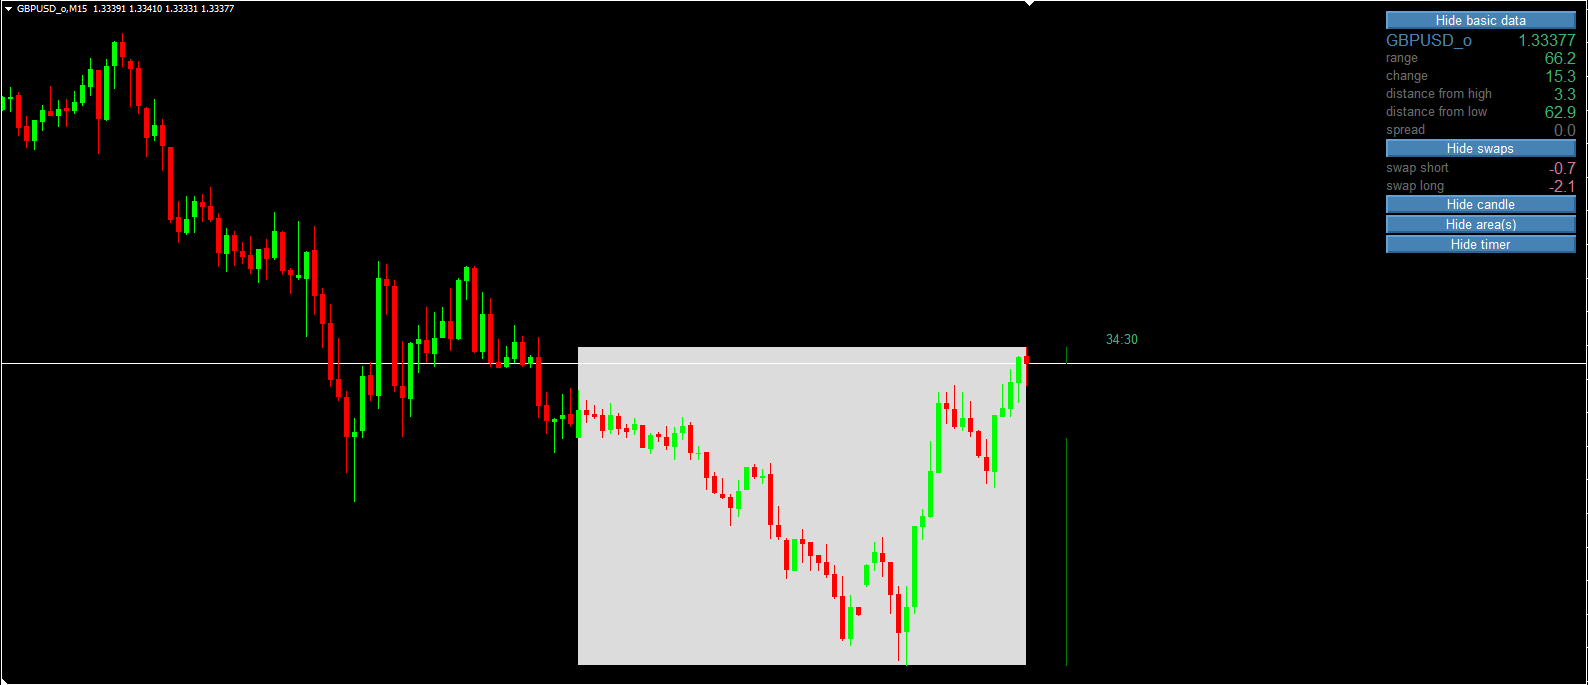
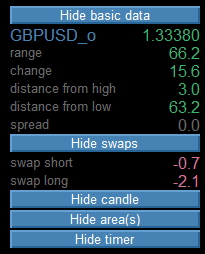
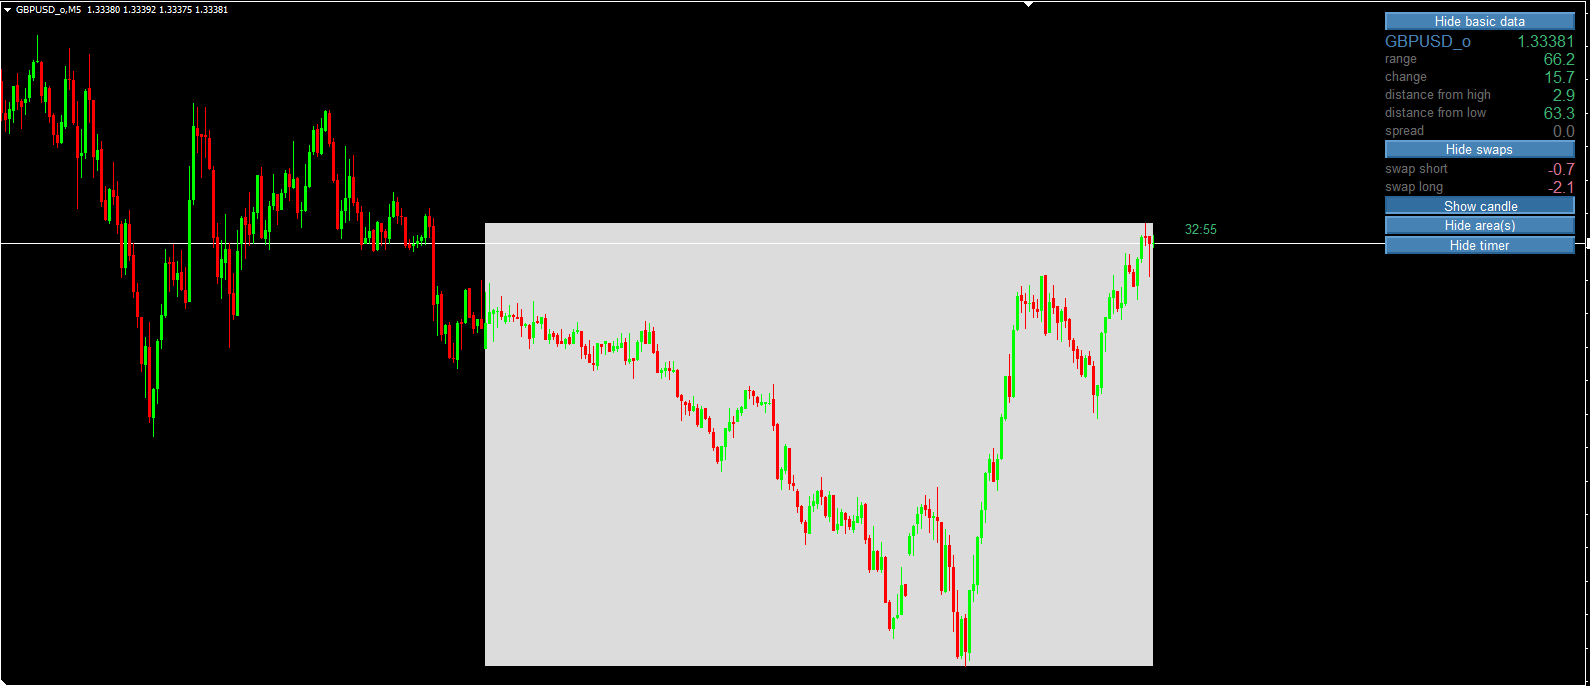
1. Comprehensive Market Snapshot
Real-time price display with color-coded changes
Daily range measurement (high-low)
Price change from previous close
Distance from daily high/low
Current spread monitoring
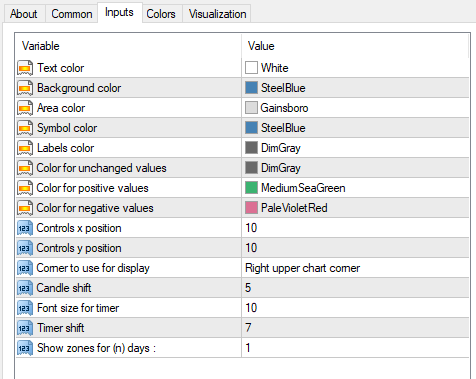
2. Advanced Visualization Tools
Customizable colored zones for daily/weekly/monthly ranges
Interactive buttons to toggle different data views
Clear color-coding for positive/negative values
Adjustable positioning on chart
3. Unique Trading Advantages
FeatureBenefit
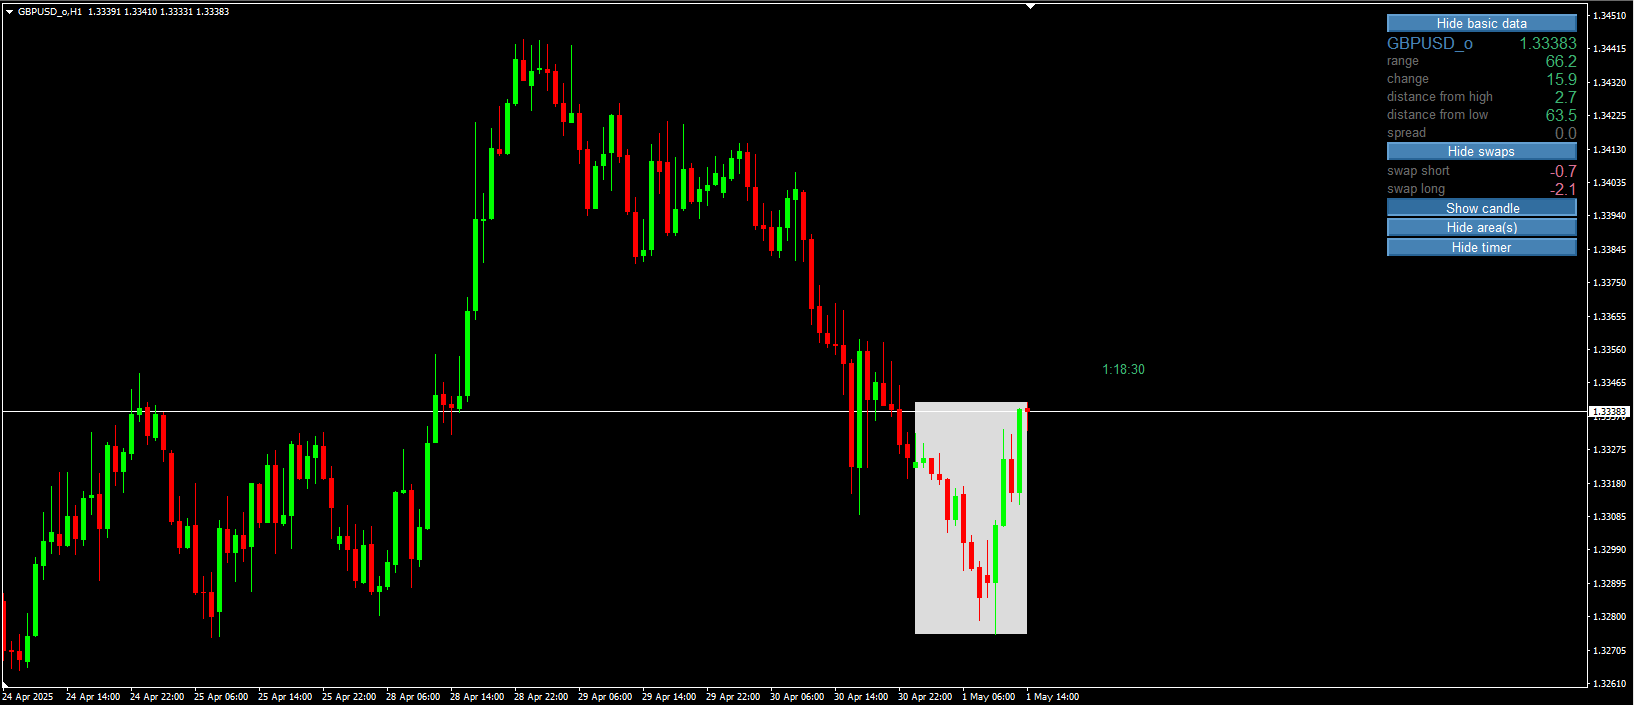
Multi-timeframe supportWorks on all timeframes from M1 to monthly
Customizable displayShow/hide elements with one click
Visual price zonesQuickly identify key support/resistance
Integrated timerTrack trading session progress
How It Works
Core Components
Price Data Module
Tracks open, high, low, close of current daily candle
Calculates price change in pips
Measures distance from daily extremes
Visual Zones
Draws colored rectangles showing daily/weekly/monthly ranges
Adjustable transparency for chart visibility
Swap Information
Displays both long and short swap values
Helps traders account for holding costs
Session Timer
Countdown to candle close
Color changes based on time remaining
Calculation Logic
mql4
// Sample calculation for daily range
double dailyRange = (rates[ZonesCount-1].high - rates[ZonesCount-1].low) / _Point / pipModifier;
Practical Trading Applications
1. Day Trading Strategies
Use the daily range to set realistic profit targets
Monitor distance from high/low for potential reversals
Watch the session timer for end-of-day closing flows
2. Swing Trading Advantages
The price zones help identify consolidation areas
Swap information assists in position holding decisions
Weekly/Monthly views provide bigger picture context
3. Risk Management
Spread monitoring helps avoid high-cost entries
Visual zones serve as natural stop-loss levels
Color-coded changes highlight market sentiment
Why Traders Love This Indicator
All-in-One Solution: Combines multiple essential tools
Customizable Interface: Show only what you need
Clear Visuals: Color-coding enhances quick analysis
Non-Repainting: Calculations based on completed candles
Multi-Asset Compatibility: Works across all instruments
Pro Tips for Optimal Use
Combine with Price Action:
Look for candlestick patterns at zone boundaries
Watch for false breakouts from daily ranges
Session Trading:
Use the timer for news event preparation
Monitor the first/last hour volatility
Position Sizing:
Adjust trade size based on current daily range
Use ATR (included) for volatility-adjusted stops
Conclusion
The Best Daily Data indicator transforms how traders interact with daily market information by:
✅ Providing instant market snapshots
✅ Highlighting key price levels
✅ Tracking essential metrics
✅ Saving analysis time