
This "The Winning Version" indicator is an advanced analytical tool used to simulate market trends and analyze volume and price levels through Volume Profile and TPO (Time Price Opportunity) Profile. With the help of price and volume data in different timeframes (daily, weekly, monthly), this indicator assists traders in receiving more accurate buy and sell signals, making smarter decisions in the market.
How the Indicator Works & Features:
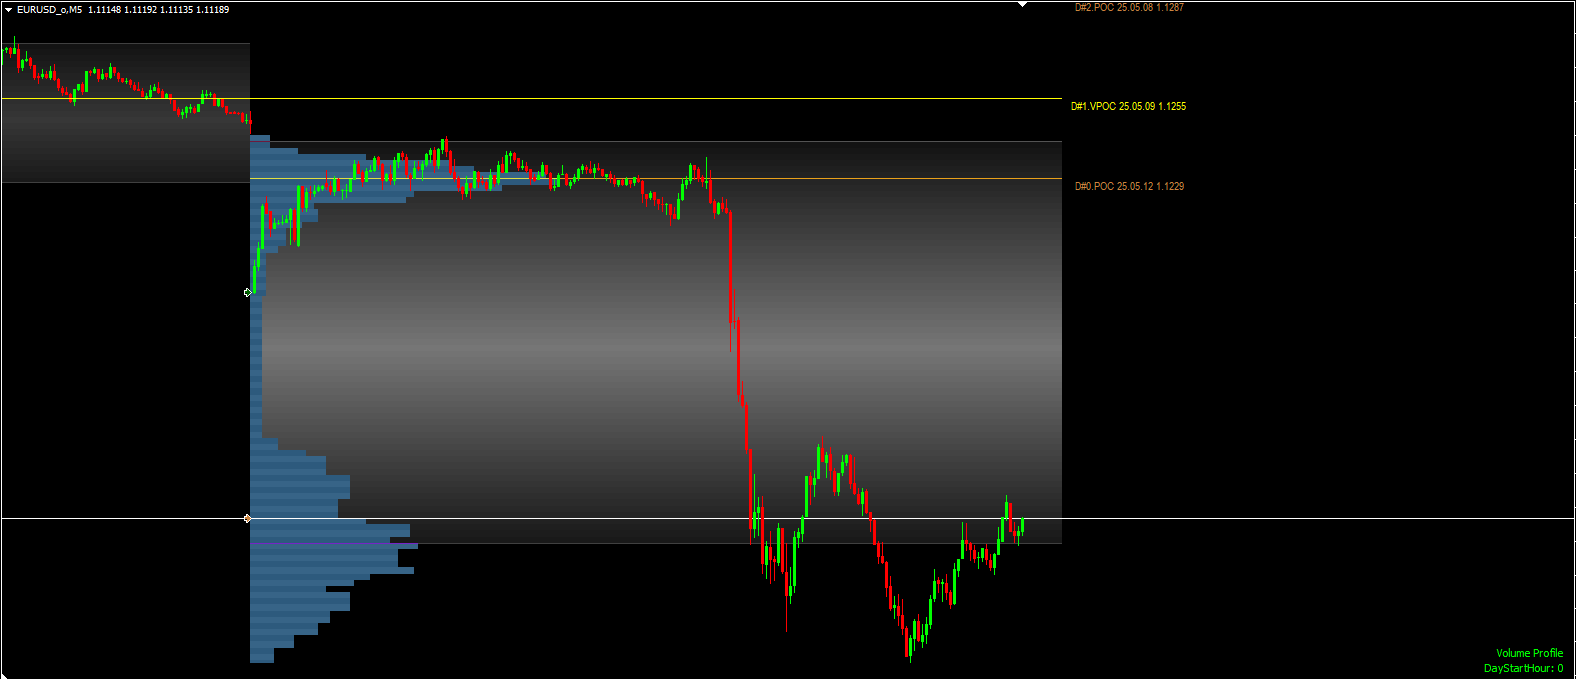
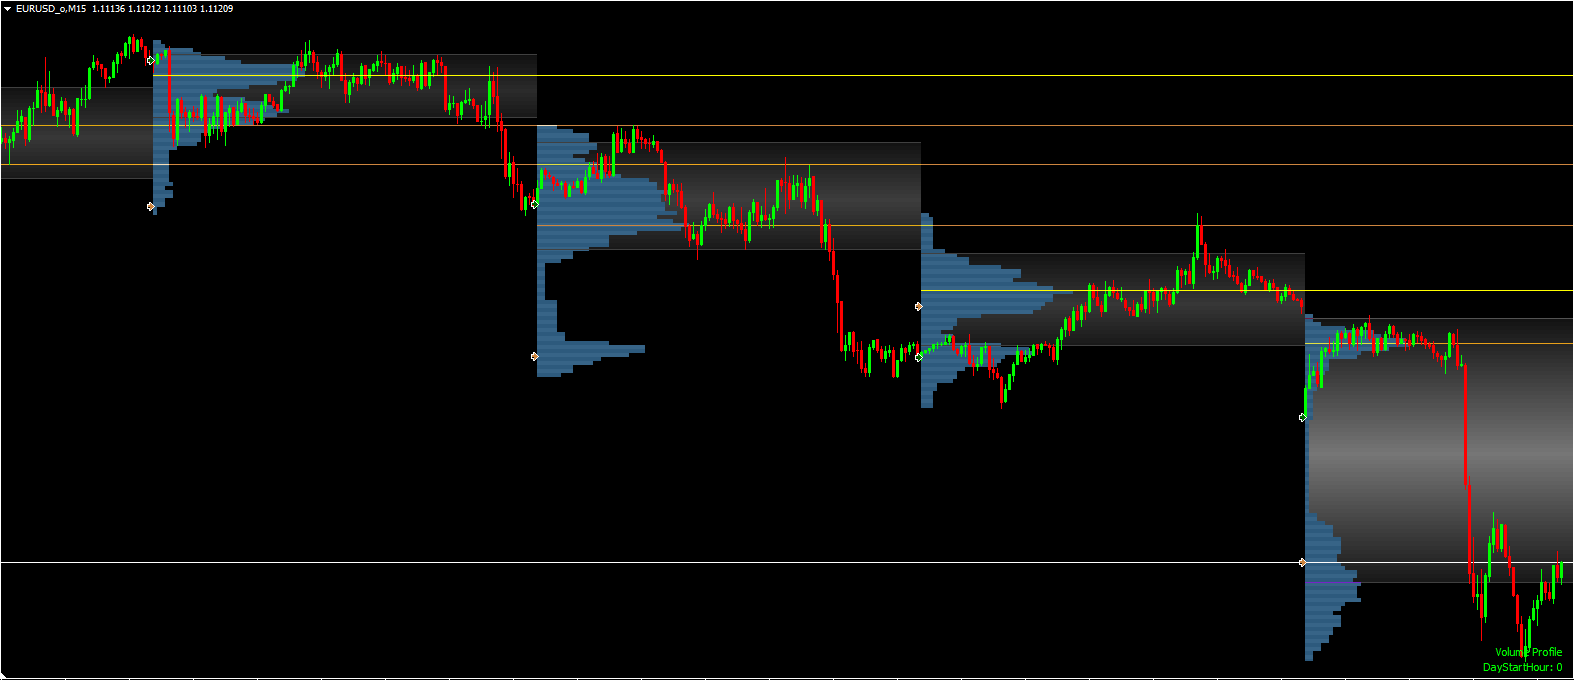
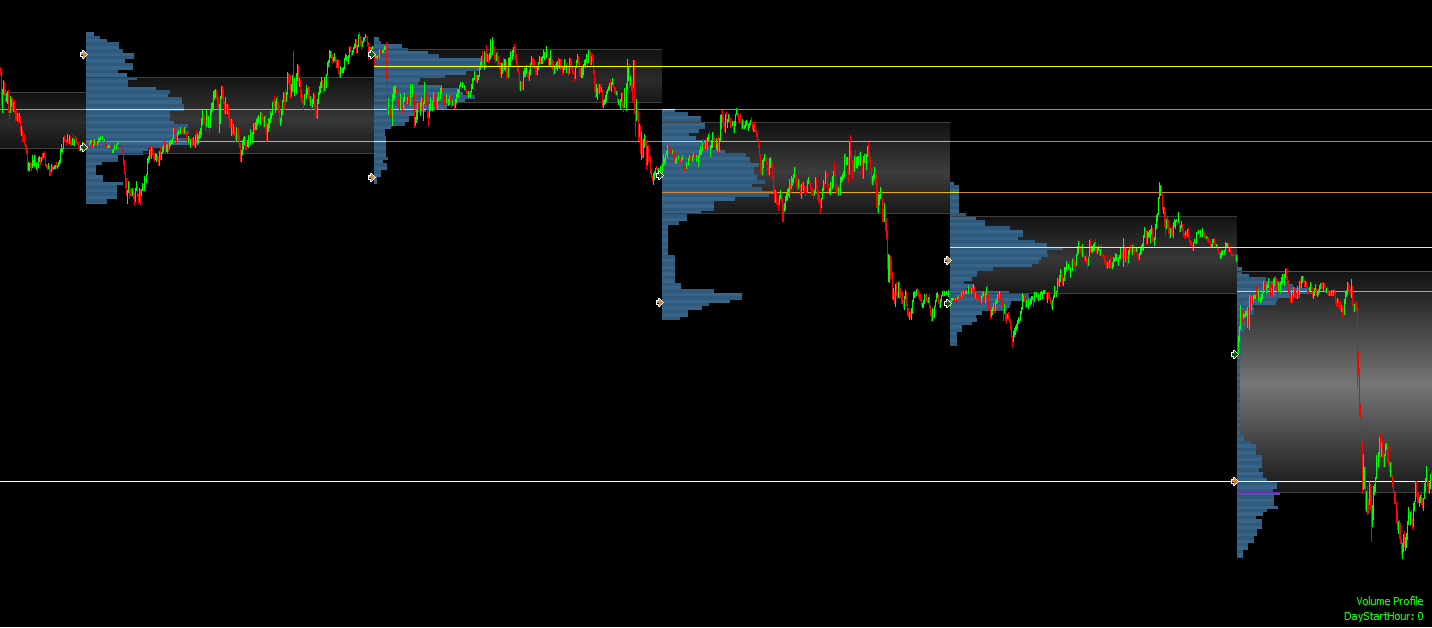
Volume Profile & TPO Profile:
The "The Winning Version" indicator calculates both Volume Profile and TPO Profile. These features are designed to simulate and analyze important support and resistance zones in the chart.
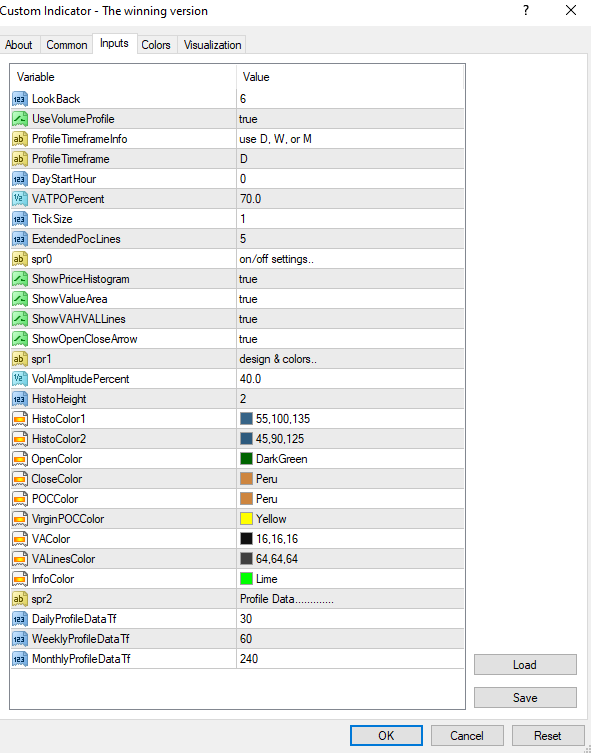
Volume and Price Settings:
LookBack: The number of candles used for calculating the profile.
ProfileTimeframe: Selects the timeframe for the profile (daily, weekly, monthly).
VATPOPercent: Percentage of volume or TPO to determine value areas.
DayStartHour: The start hour of the day for profile calculation.
Design and Color Settings:
ShowPriceHistogram: Displays the price histogram.
ShowValueArea: Displays the value area.
ShowVAHVALLines: Displays the VA and VAL lines.
ShowOpenCloseArrow: Displays arrows for the open and close prices.
Other Settings:
VolAmplitudePercent: The volume amplitude percentage.
HistoHeight: The height of the histogram.
POCColor, VirginPOCColor: Colors for the POC (Point of Control) lines.
VAColor, VALinesColor: Colors for the value area and its lines.
Signals and Alerts:
The indicator can trigger various alerts, including messages, sounds, emails, and notifications for specific buy or sell signals.
Daily, Weekly, and Monthly Profiles:
The indicator can calculate the volume and price profiles in different timeframes (daily, weekly, monthly), identifying major support and resistance levels.
Customizable Settings:
LookBack: The number of candles used for calculating the profile.
ProfileTimeframe: Select the timeframe for the profile.
VATPOPercent: The percentage of volume or TPO for value areas.
TickSize: The tick size in price.
ExtendedPocLines: The number of extra lines to display on the chart.
HistoHeight: The height of the histogram for display.