

🎨 “Thinking About Colors” — When Trend Meets Precision, Color Speaks! 🎨
A Powerful, Multi-Timeframe RSI + Volatility Band Indicator with Heiken Ashi Support and Custom Alerts for MetaTrader 4
🔍 Overview
"Thinking About Colors" is one of the most advanced and customizable MT4 indicators developed by R.KH. It extends the logic of TDI (Traders Dynamic Index) by combining RSI (multiple methods), moving averages, and volatility bands — all visualized in a separate indicator window using meaningful colors.
With support for Heiken Ashi price types, over 6 MA smoothing types, and multiple RSI modes, this tool is designed to offer deep insight into market dynamics while maintaining a clean and colorful visual layout.
🧠 Core Functionality
At the heart of the indicator:
✅ RSI Line: Measures strength based on customizable price type and method
✅ Signal Line: Smooths RSI line to confirm trends
✅ Volatility Bands: Upper, middle, and lower bands to assess range and volatility
✅ Heiken Ashi: Optional source price for trend filtering
✅ Trend Detection: Tracks crossover between RSI and Signal Line
✅ Custom Alerts: On crossover, direction change, and more
✅ Arrows & Labels: Optional visual signals directly on the chart
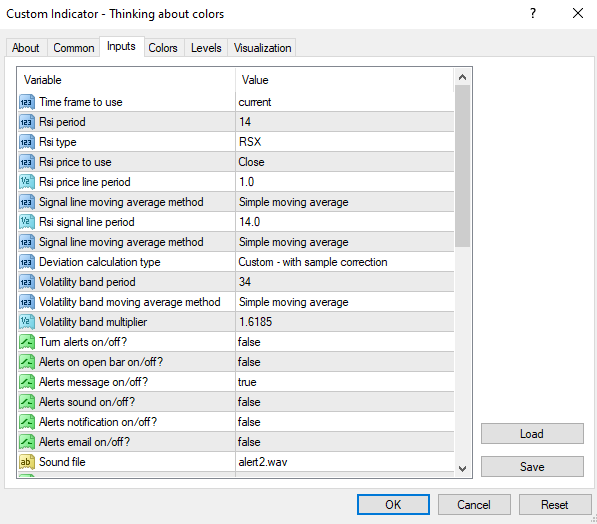
⚙️ Input Settings
📈 RSI Section
ParameterDescription
RsiPeriodPeriod for RSI calculation
RsiMethodType of RSI (RSX, Slow, Rapid, Harris, Cuttler, etc.)
RsiPricePrice type (Close, Heiken Ashi, Weighted, etc.)
RsiPLPeriodPeriod for RSI Price Line (RSI smoothing)
RsiPLMaModeMA method for RSI Line
RsiSLPeriodPeriod for Signal Line
RsiSLMaModeMA method for Signal Line
🎯 Volatility Bands
ParameterDescription
VolBandPeriodPeriod used for band calculation
VolBandMaModeMA method used for centerline
VolBandMultiplierDetermines band width based on deviation
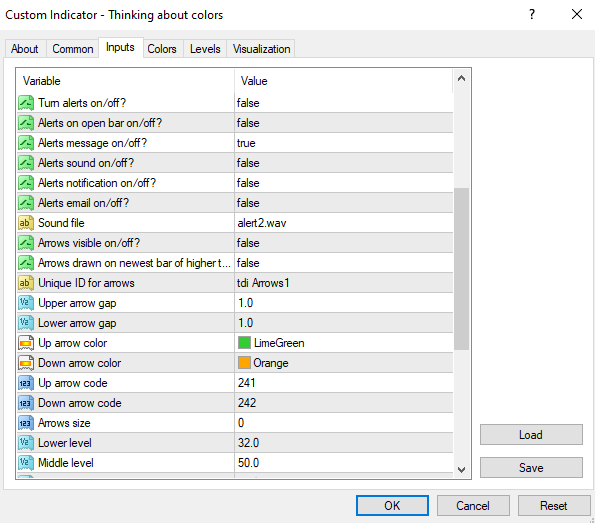
🔔 Alerts & Arrows
ParameterDescription
alertsOnEnable alerts
alertsMessagePopup alert message
alertsSoundSound alert
alertsNotifyMobile push notification
alertsEmailEmail notification
arrowsVisibleShow arrows on chart
arrowsUpColor/DnColorColors for arrows
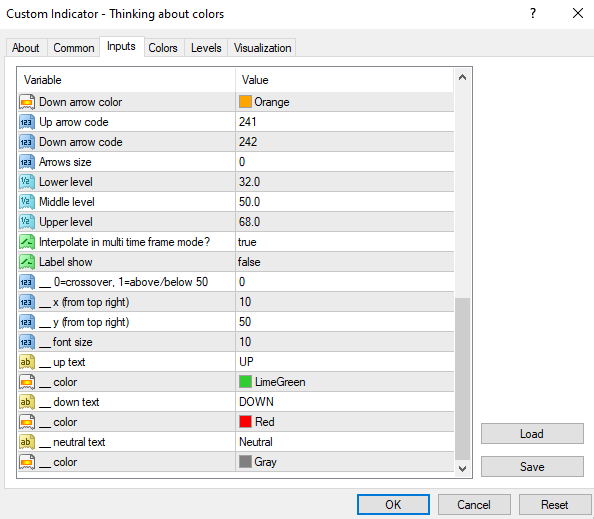
🖼️ Visualization & Display
ParameterDescription
TimeFrameSet to use different timeframe
InterpolateSmooth drawing between bars
label_showShow trend label (UP, DOWN, Neutral)
label_type0 = crossover logic, 1 = above/below 50 level
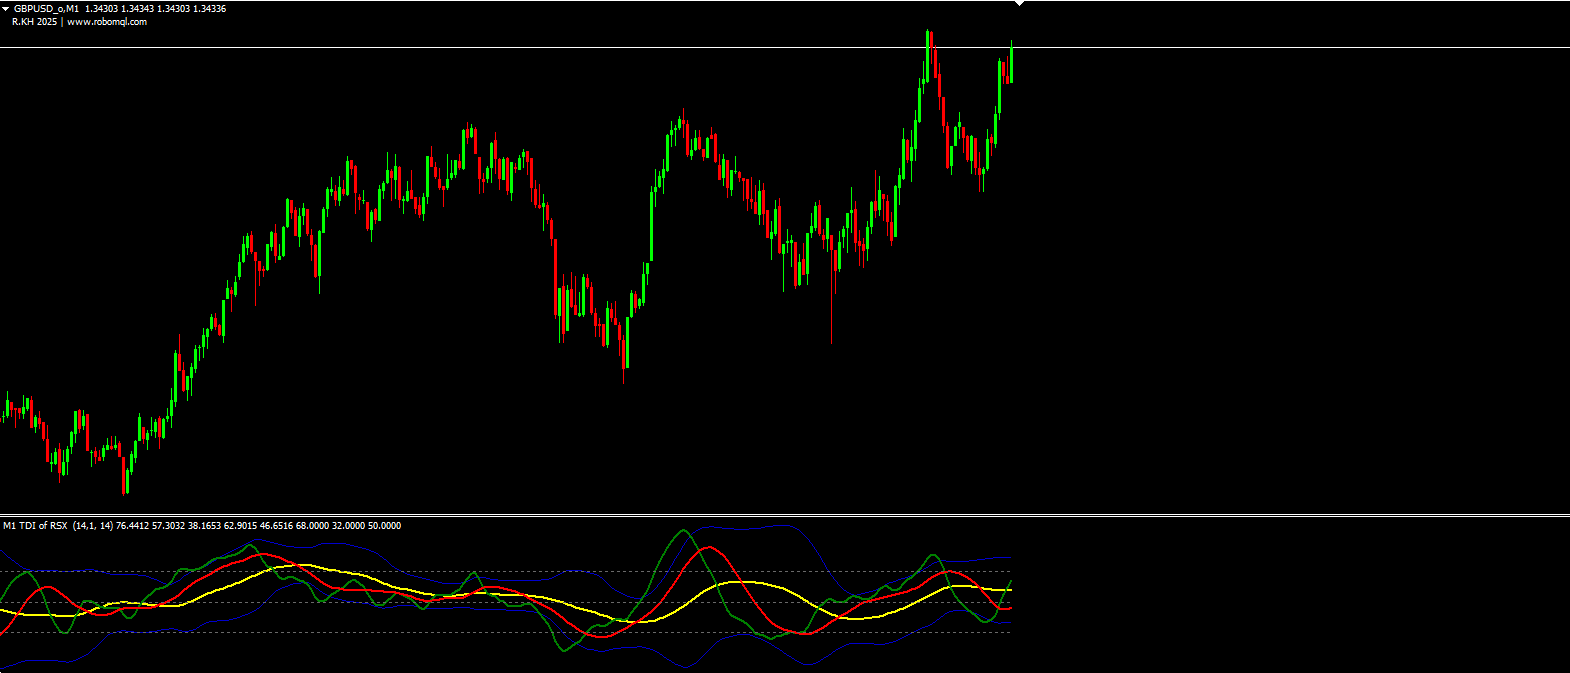
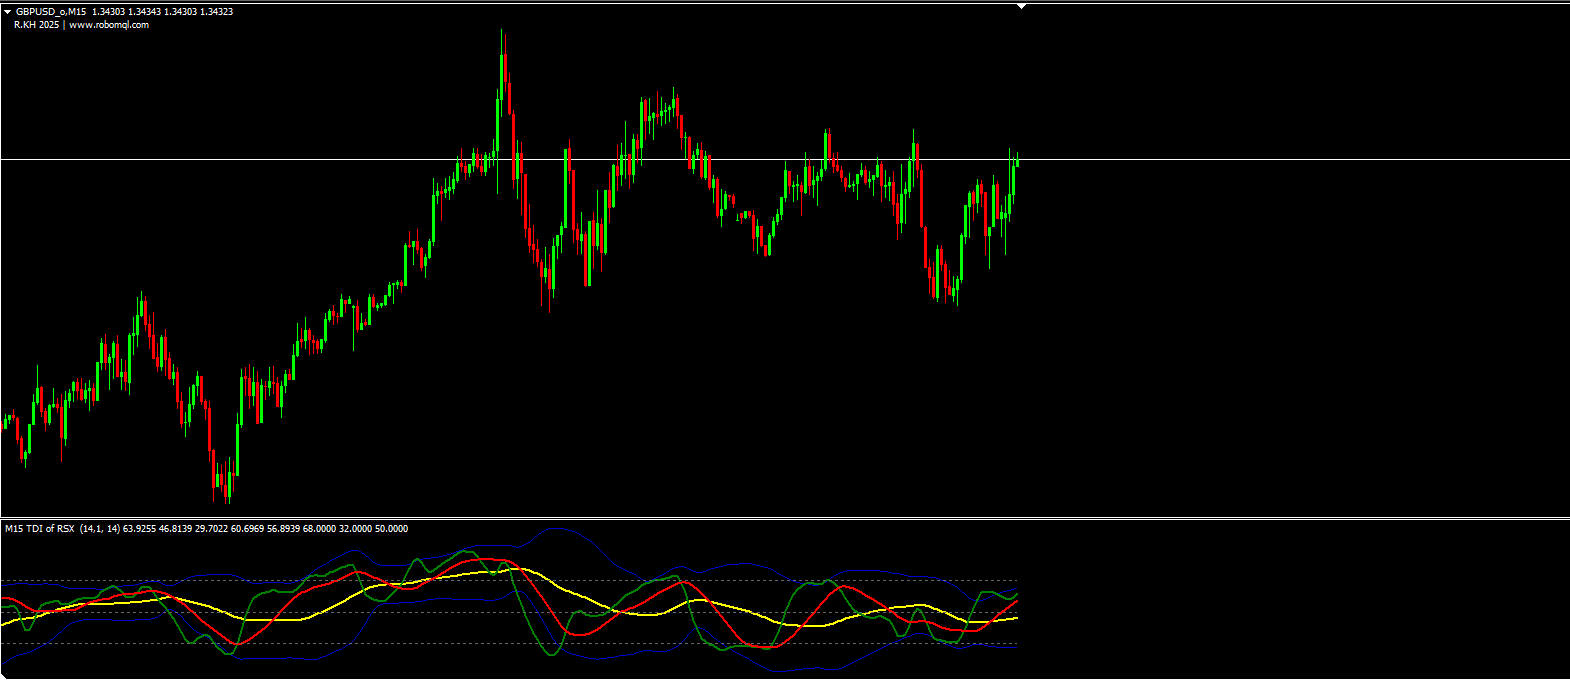
📈 Display Components
Line/ColorMeaning
Blue LineVolatility Upper Band (bandUp)
Yellow LineMiddle Band (bandMi)
Blue Line (2)Lower Band (bandDn)
Green LineRSI Price Line (rsiPL)
Red LineRSI Signal Line (rsiSL)
Gray Dotted LinesLevels 32 / 50 / 68 for visual guide
Arrows (Optional)Visual Buy/Sell Cues on chart
LabelShows current trend state (based on crossover or level)
🔍 Trend Logic
Uptrend:
RSI Price Line Signal Line
Optional: both lines above 50 (if label_type = 1)
→ Green arrow appears, “UP” label shown
Downtrend:
RSI Price Line Signal Line
Optional: both lines below 50
→ Orange arrow appears, “DOWN” label shown
Neutral:
RSI and Signal Line in opposite halves of 50 zone
→ Gray label displayed
🔔 Alert System
Alerts are triggered only once per new trend or crossover:
📬 Popup Alert: Optional alert message with symbol, time, direction
📧 Email Alert: Optional email trigger
📱 Push Notification: Optional mobile alert
🔊 Sound: Custom sound file support (default: alert2.wav)
🧠 Custom Price Options
Supports 30+ types of prices, including:
Standard: Close, Open, High, Low, Median, Typical
Heiken Ashi: Classic and "better formula" versions
Biased Types: Trend-based high/low calculation
This allows traders to analyze market behavior through alternative perspectives.
🌐 Multi-Timeframe Mode
You can apply the indicator in MTF mode using the TimeFrame input. When enabled:
Main window displays interpolated higher timeframe RSI and bands
Interpolation ensures smooth transition between candles
Labels and alerts are still synced to main chart
✅ Benefits
Fully customizable trend-detection logic
Works with any symbol or timeframe
Ideal for scalping, swing, or long-term strategies
Combines RSI, moving averages, volatility, and price types
Easy to integrate into existing templates and systems
👨💻 Developer Info
Name: R.KH
Indicator: Thinking About Colors
Version: 2025
Website: www.robomql.com