

Trader Lines Indicator - Complete Guide
🏆 Motto:
"Trade with precision – let the lines guide your way to profits!"
📌 Overview
The Trader Lines indicator is a polynomial regression-based tool that plots dynamic support/resistance levels using advanced mathematical calculations. It creates a central trend line with multiple Fibonacci-based deviation channels, helping traders identify potential reversal zones and trend strength.
🔧 Indicator Settings
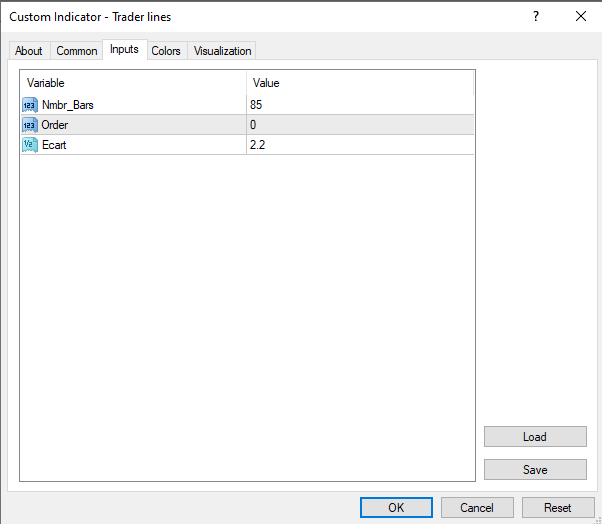
Input Parameters:
Nmbr_Bars (Default: 85) – Number of bars used for calculations.
Order (Default: 0) – Polynomial regression order (higher values create more complex curves).
Ecart (Default: 2.2) – Multiplier for standard deviation bands.
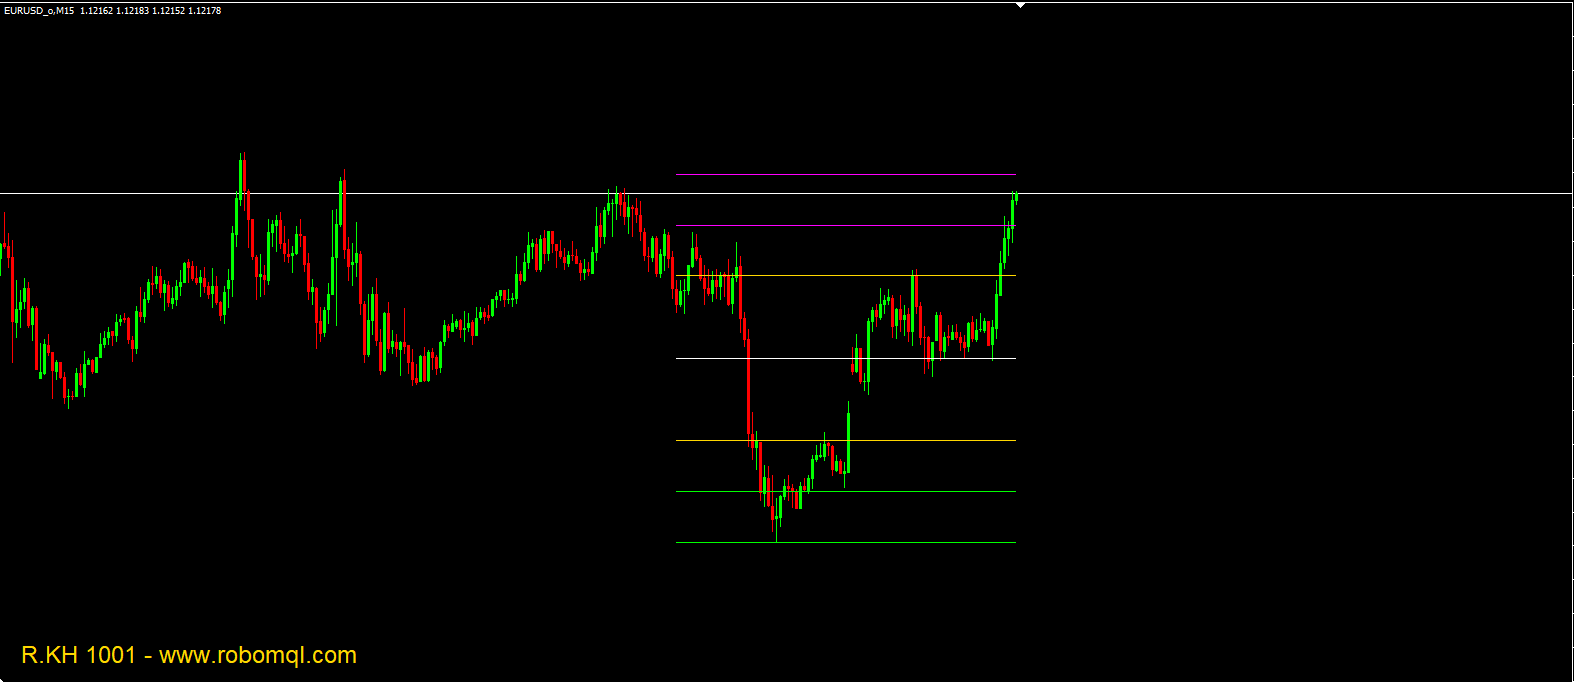
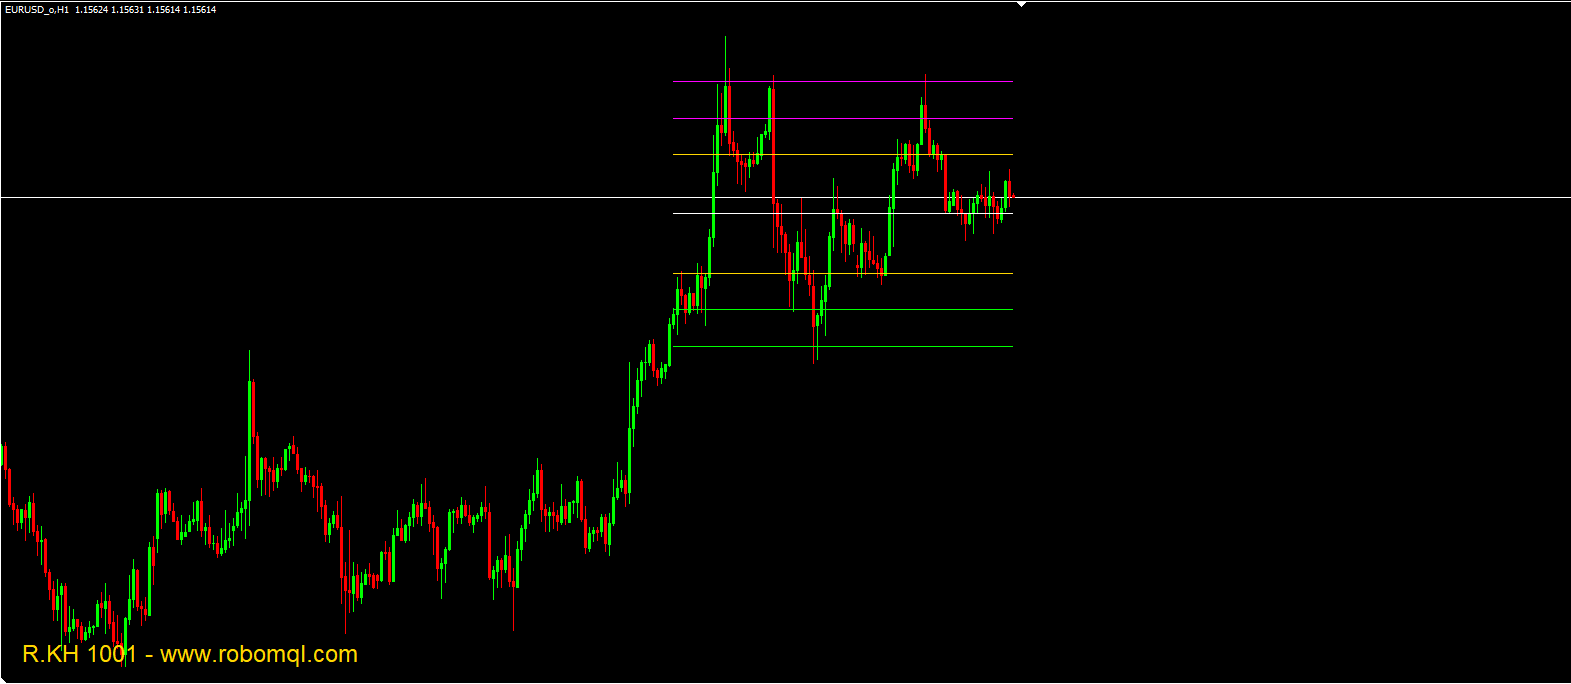
Visual Elements:
White Line: Central polynomial regression line.
Gold Lines: Inner support/resistance (Fibonacci 1.618 levels).
Fuchsia Lines: Intermediate levels (Fibonacci 1.382 levels).
Lime Lines: Outer bands (standard deviation-based extremes).
📊 How It Works
Core Algorithm:
Polynomial Regression Calculation:
Fits a curve to price data using matrix algebra (Gaussian elimination).
Adjusts complexity based on the Order parameter.
Deviation Bands:
Uses standard deviation (iStdDev) multiplied by Ecart to create dynamic channels.
Applies Fibonacci ratios (1.382 & 1.618) to plot intermediate levels.
Dynamic Levels:
Upper Bands (Resistance):
Lime = Central line + (StdDev × Ecart)
Fuchsia = Central line + (Upper Band - Central) / 1.382
Gold = Central line + (Fuchsia Band - Central) / 1.618
Lower Bands (Support):
Mirrors the same logic downward.
🎯 Trading Strategy Suggestions
Buy Signals:
When price bounces off lower Gold/Lime lines with confirmation (e.g., bullish candlestick patterns).
When price breaks above the central white line (trend reversal confirmation).
Sell Signals:
When price rejects upper Gold/Lime lines with bearish confirmation.
When price breaks below the central line in a downtrend.
Best Practices:
Combine with RSI/MACD for overbought/oversold confirmation.
Works best on H1/D1 timeframes for swing trading.
Adjust Ecart for volatility – Increase in trending markets, decrease in ranging markets.
🔍 Additional Notes
Mathematical Complexity: The indicator uses linear algebra to solve polynomial coefficients.
Self-Adjusting: The bands widen/narrow based on market volatility.
Expiration Check: Includes a 2035 year check (likely a legacy code artifact).
📜 Developer & Source
Developer: R.KH 1001
Source: RoboMQL
🚀 Trade smart, stay disciplined – the market rewards the patient! 🚀