

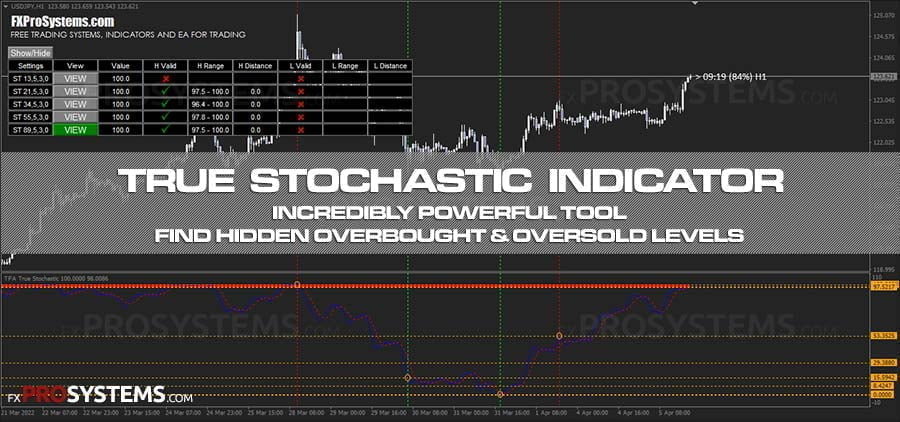
True Stochastic Indicator - Identifying Hidden Support and Resistance Levels
The True Stochastic Indicator offers a fresh interpretation of the classic stochastic, enhanced with advanced features and a renewed perspective for trading. It's astounding how many indicators and expert advisors have been developed based on the stochastic. Today, we are presented with another version of this indicator, executed with notable success.
Characteristics of the True Stochastic Indicator:
Platform: MetaTrader 4
Currency Pairs: Any, with a recommendation for major pairs
Trading Time: Any trading session
Time Frame: Any, with a preference for H1 and H4
Recommended Brokers: RoboForex, XM, FBS
Trading Rules:
The MT4 True Stochastic Indicator can be applied to any trading asset chart. However, major currency pairs are prioritized due to their high volatility. While the time frame can be flexible, higher time frames like H1 and H4 are recommended.
The standard stochastic from the MT4 indicator set displays overbought and oversold levels, which inform our decisions to open sell or buy positions. This is crucial for reversal strategies. In the case of the True Stochastic Indicator, the concept remains unchanged. However, the indicator's author suggests focusing on the 1-10 and 90-100 levels for trading, considering historical price movements when these levels were previously reached.
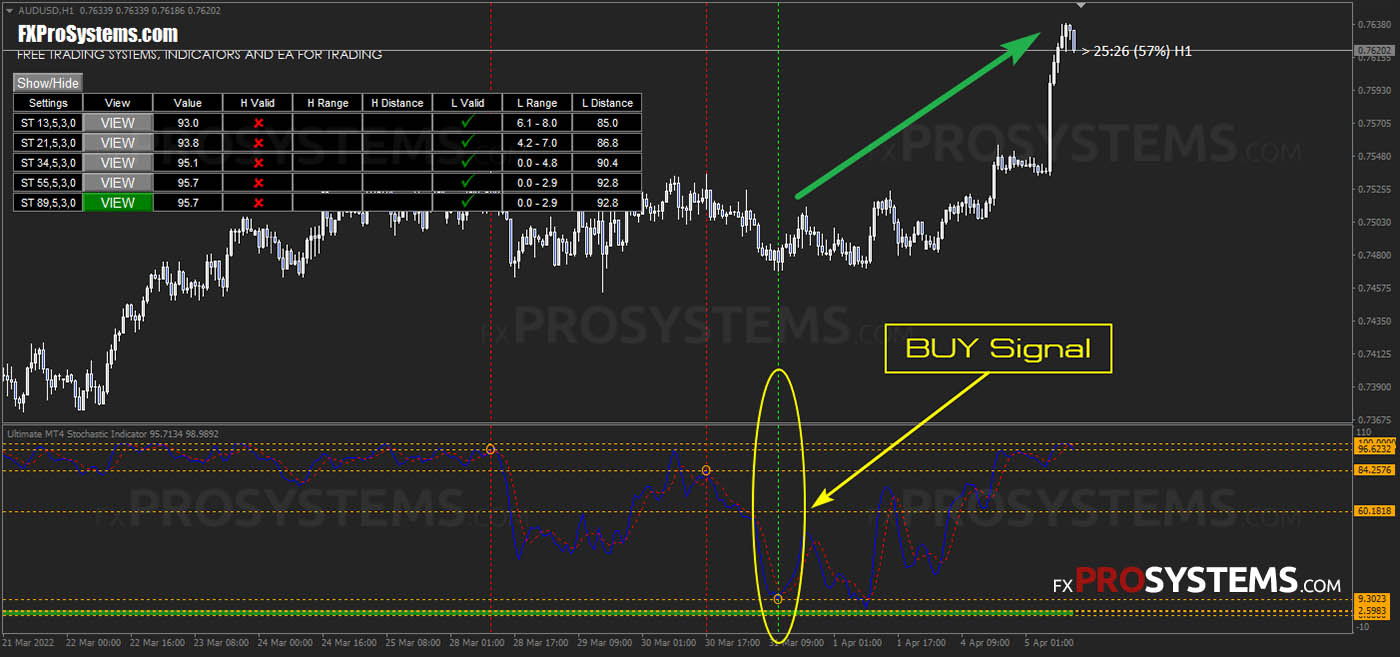
Accordingly, we will open a Buy order when:
- The oscillator reaches levels 1-10, and
- A yellow circle appears with a green dotted vertical line: true-stoch-buy-signal
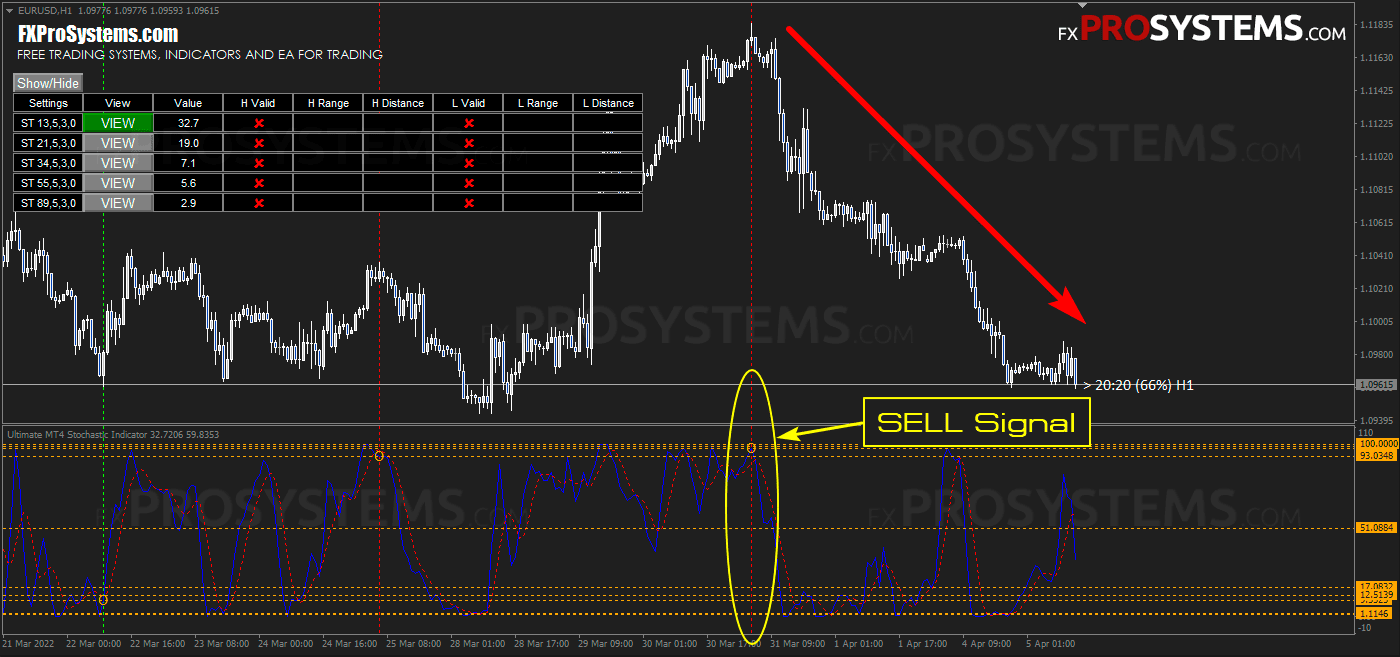
We will open a Sell order when:
- The oscillator reaches levels 90-100, and
- A yellow circle appears with a red dotted vertical line: true-stoch-sell-signal
Set a Stop Loss 10-20 pips above/below the price pivot point.
Take Profit = Stop Loss * 3 (alternatively, use support/resistance levels, round numbers, etc.)
The indicator includes an information panel. More details about the values in this dashboard can be found HERE.
For additional insights, you can watch this helpful video.
We are all aware that the stochastic has a notable disadvantage—prolonged unidirectional trends without corrections. The TFA True Stochastic is not exempt from this limitation. To mitigate this, the author advises entering the market only on the sixth touch of the upper or lower levels by the oscillator. This strategy may help avoid prolonged trends, although it is not foolproof.