
Two Sides Market Indicator - Comprehensive Guide
🏆 Motto:
"See both sides of the market – trade with clarity and confidence!"
📌 Overview
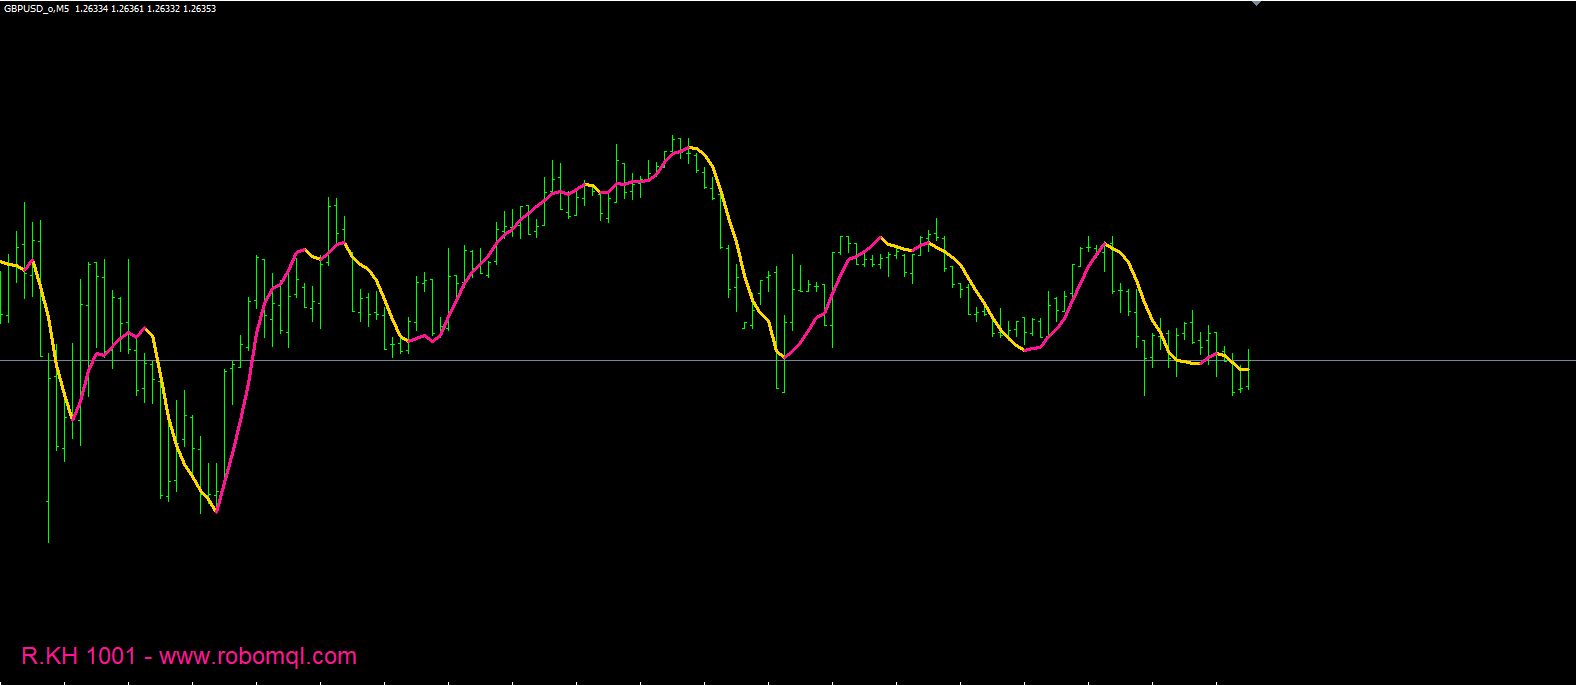
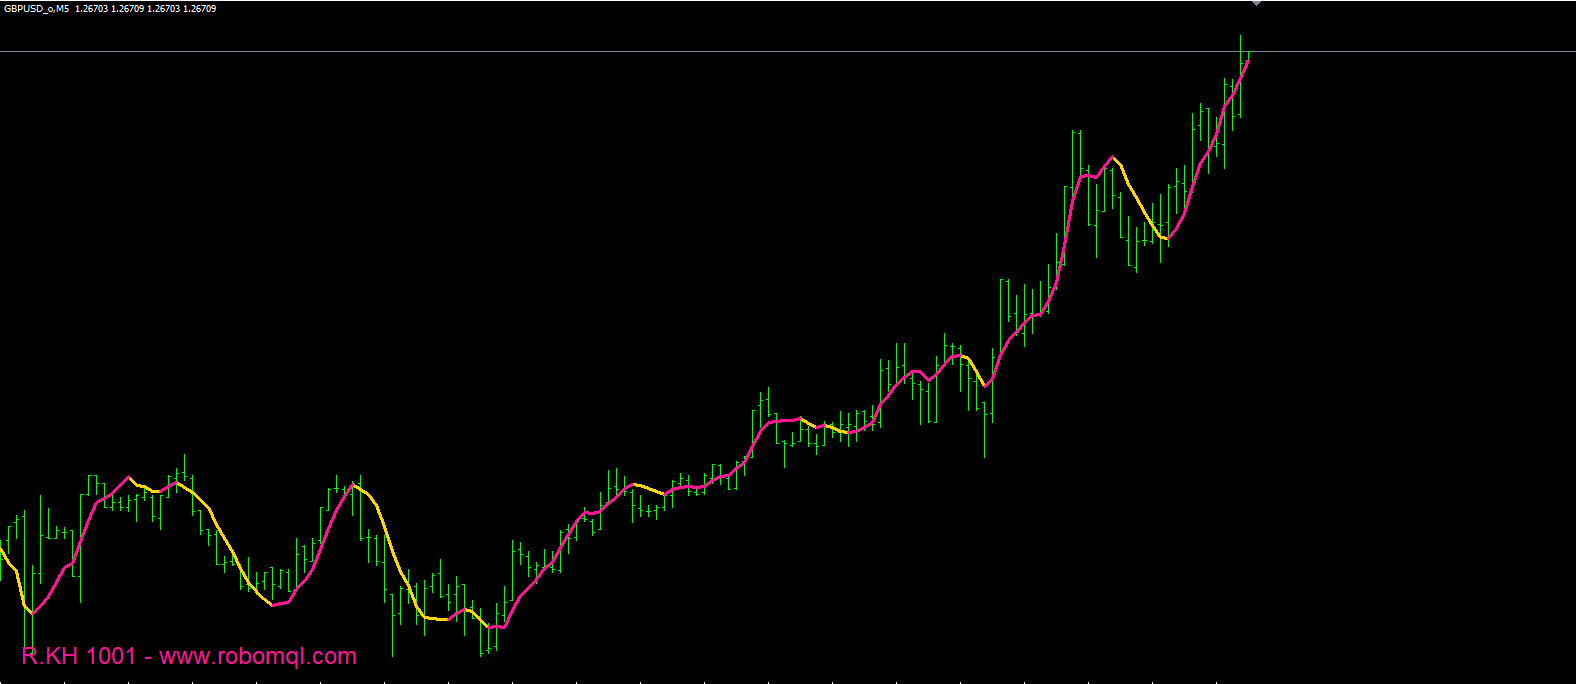
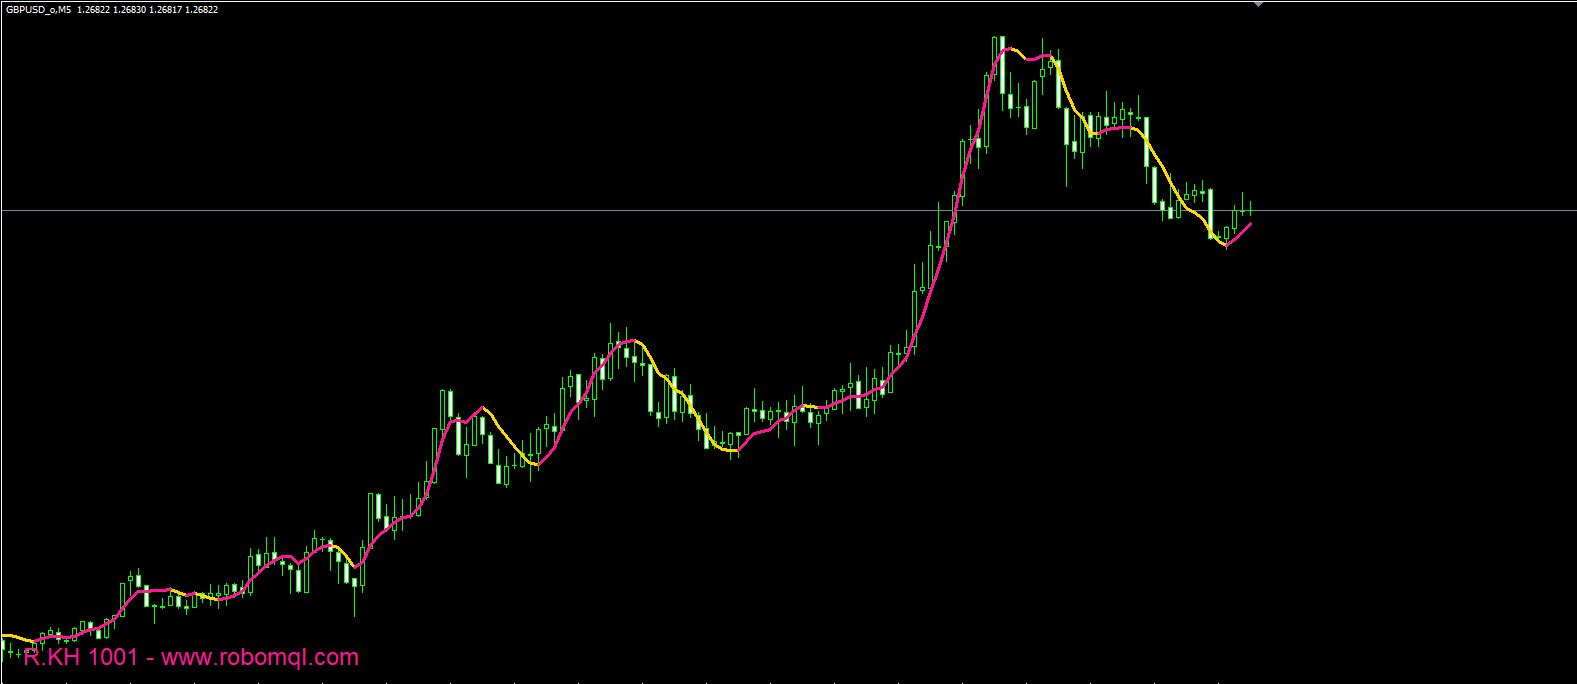
The Two Sides Market indicator is a weighted moving average-based tool designed to highlight trend direction and potential reversals. It uses a unique calculation method to dynamically color price movements, helping traders quickly identify bullish and bearish phases.
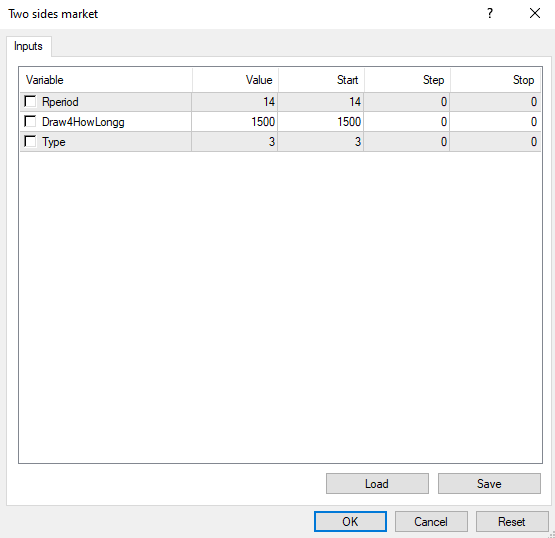
🔧 Indicator Settings
Input Parameters:
Rperiod (Default: 14) – The lookback period for calculations.
Draw4HowLongg (Default: 1500) – Controls how many bars are processed.
Type (Default: 3) – Determines which price type is used:
1 = High
2 = Low
3 = Close
Visual Customization:
Gold Line: Bullish momentum (price moving up).
DeepPink Line: Bearish momentum (price moving down).
📊 How It Works
Indicator Logic:
Weighted Moving Calculation:
Uses a modified weighted moving average formula based on the selected price type (High, Low, or Close).
The weight factor (i - lengthvar) emphasizes recent price movements more than older ones.
Trend Coloring:
Gold Line: Activates when wt[shift] wt[shift+1] (uptrend).
DeepPink Line: Activates when wt[shift] wt[shift+1] (downtrend).
The indicator dynamically switches colors to reflect trend changes.
🎯 Trading Strategy Suggestions
Buy Signal:
When the Gold Line appears, indicating upward momentum.
Sell Signal:
When the DeepPink Line appears, indicating downward momentum.
Trend Confirmation:
Use with support/resistance levels or volume analysis for stronger signals.
Best Timeframes:
Works well on H1, H4, D1 for swing trading.
🔍 Additional Notes
Works Best in Trending Markets – May give false signals in choppy conditions.
Combine with RSI or MACD – For additional confirmation.
Adjust Rperiod for Sensitivity – Shorter periods (e.g., 7) react faster but may produce more noise.
📜 Developer & Source
Developer: R.KH 1001
Source: RoboMQL
🚀 Trade smart, stay ahead of the curve! 🚀