

Volatmeter 2.2
This indicator measures volatility across multiple timeframes, aiming to identify flat markets, volatility spikes, and price movement cycles. While it may not be the easiest volatility indicator to interpret, it is certainly a very powerful tool.
Trade when volatility is in your favor.
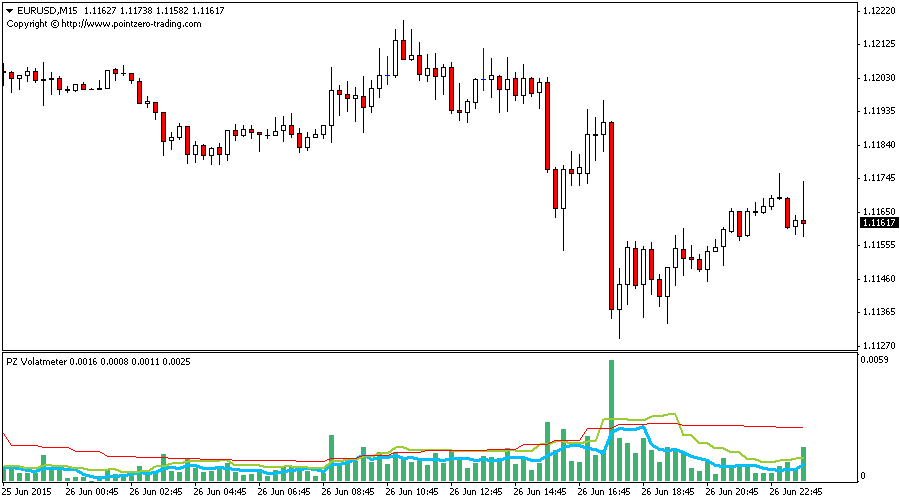
Identify short-term volatility and price spikes.
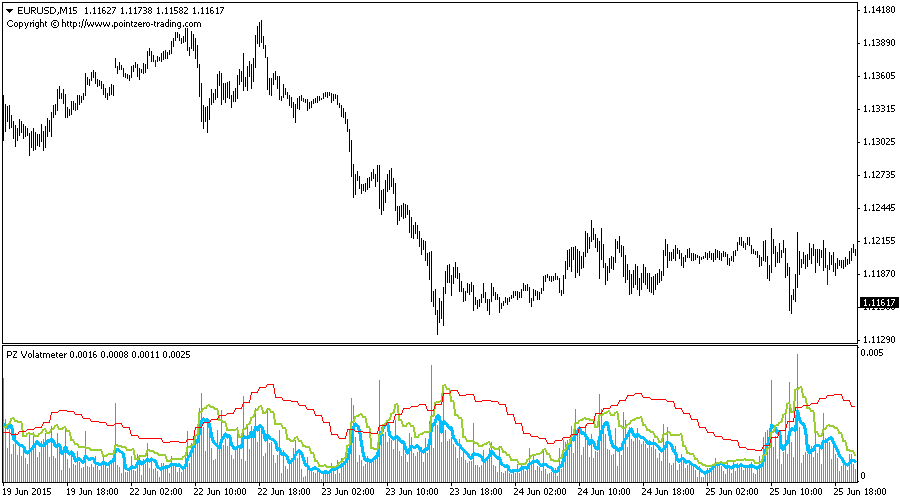
Easily spot volatility cycles.
The indicator is non-repainting.
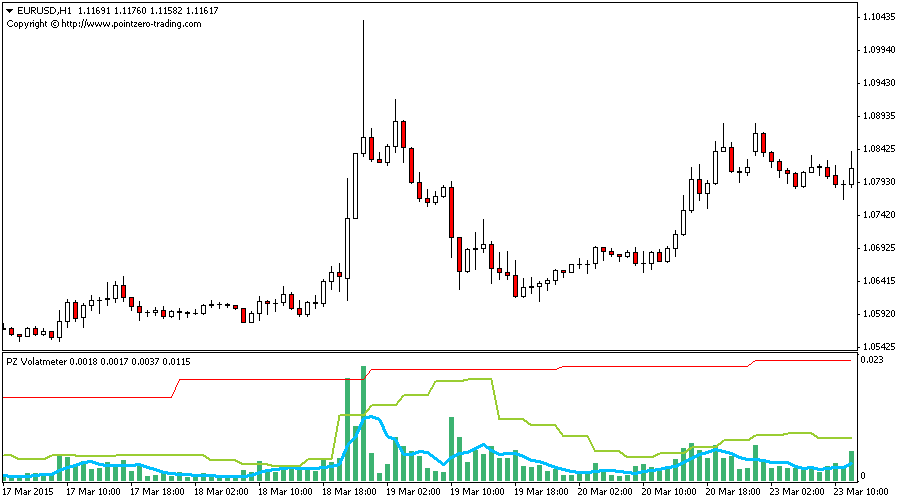
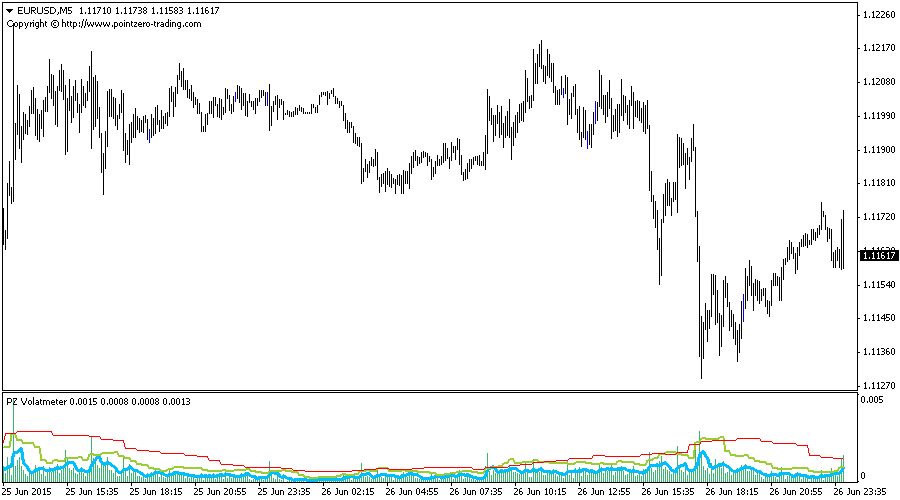
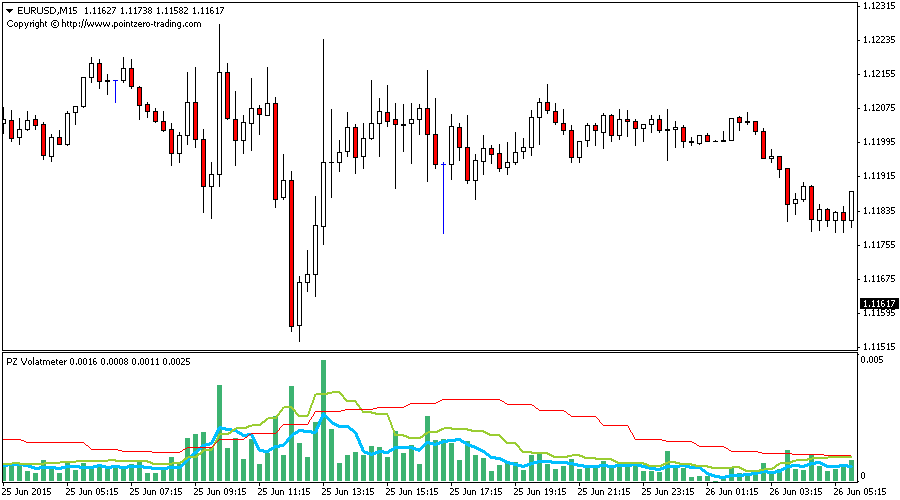
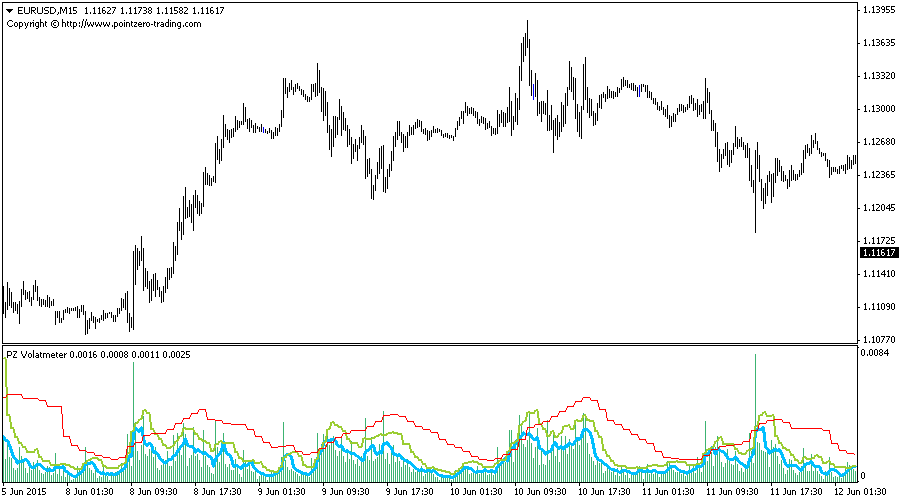
The components of the indicator include the following:
The green histogram represents the current bar's volatility.
The blue line indicates the fast volatility value.
The orange line shows the slow volatility value.
The red line signifies the higher timeframe volatility.
These elements have clear trading implications:
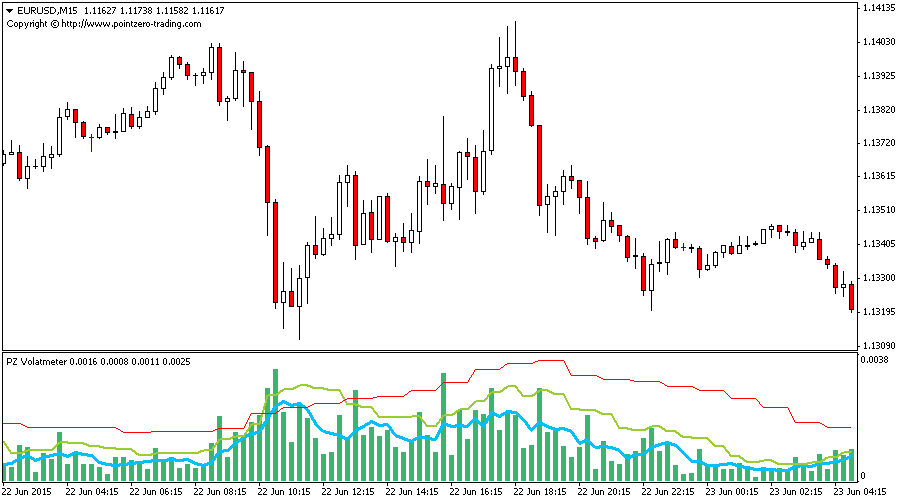
If the green histogram is above two lines, short-term volatility is extreme.
If the blue line is above the orange line, volatility is generally high.
If the orange line is above the red line, market volatility is high.
Zoom out on the chart to see the volatility cycle reflected in the red line.
When you load the expert onto any chart, you will be presented with a set of options as input parameters. Don’t worry if they seem too numerous, as the parameters are grouped into self-explanatory blocks.
Fast ATR Period: ATR period for the current timeframe.
Slow ATR Period: ATR period for higher timeframes.