

📸 Gallery
VWAP Indicator
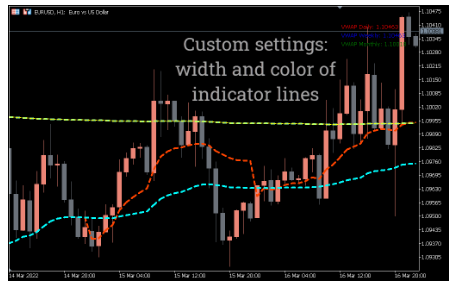
Find out market volume by comparing three different lines with the New VWAP indicator for MT5.
The Volume Weighted Average Price or VWAP indicator shows the average price of a currency pair based on weighted volume. The VWAP stands for the volume-weighted average price.
The indicator consists of three lines, each representing daily, weekly, and monthly periods. These lines detect the overall market volume and separate it based on its weight.
The VWAP indicator looks similar to Moving Averages or Bollinger Bands. The difference between the VWAP and Moving Averages is VWAP focuses more on the weighted volume.
It calculates the average price at the weighted volume. This detection of weighted volume can help you find support and resistance levels, thus identifying entry and exit points.
The indicator provides the signals when the crossover of weekly and monthly lines happens, hence producing long and short opportunities. Although the indicator works best on every timeframe, it’s best to use it on an hourly chart to not produce false signals.
How to trade with the VWAP indicator?
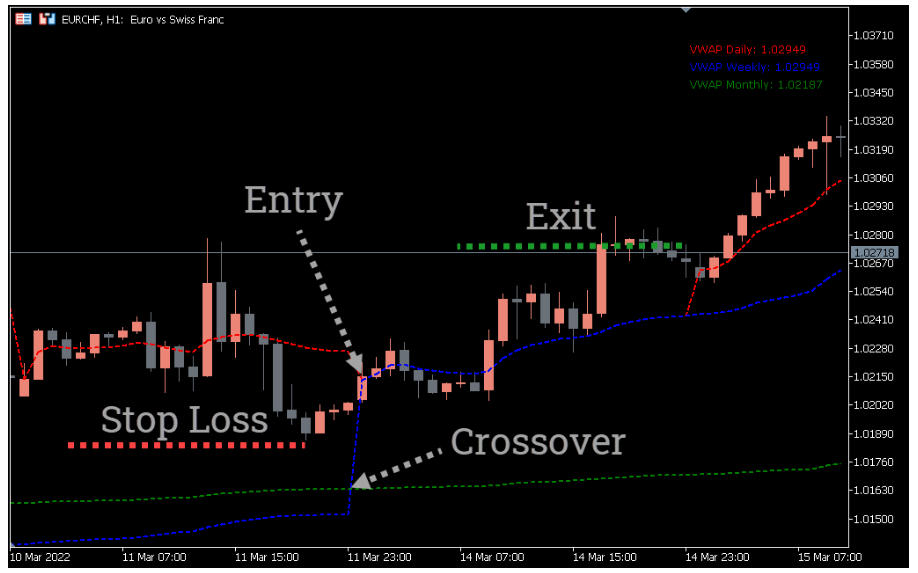
The VWAP indicator emphasizes the weighted volume through average price. This calculation helps it to identify levels of support and resistance. These levels tell you when to enter or exit the trade.
The indicator produces signals when the crossovers between the weekly and monthly lines happen. For instance, the weekly line comprises red color and the monthly line of green color.
When the weekly line goes above the monthly one, then it is a bullish signal. On the other hand, it is a bearish signal when the weekly line goes below the monthly one.


Save time withd software.
Related products.

$0

$0

$0