
Warrior Indicator - Comprehensive Explanation
This custom MetaTrader 4 indicator combines Stochastic Oscillator and Bollinger Bands to generate trading signals based on market momentum and volatility conditions. Below is a detailed breakdown of how it works:
🔵 Indicator Logic & Components
1. Core Components
Stochastic Oscillator (Main Signal Generator)
Fast %K (5)
Slow %D (11)
Smoothing (11)
Price Input (Close by default)
Calculation Method (Simple Moving Average by default)
Bollinger Bands (Volatility Filter)
Period (20)
Deviation (2)
Applied Price (Median Price)
2. How It Works
The indicator operates in two modes:
📌 Mode 1: Flat Market Detection (Low Volatility)
Checks if the Bollinger Bands width is below the flat threshold (0.004 by default).
If true, it simplifies the Stochastic signals:
Buy Signal: When %K (blue line) crosses above %D (white line), it sets:
Buf_0[i] = 55 (upper level)
Buf_1[i] = 45 (lower level)
Sell Signal: When %K crosses below %D, it sets:
Buf_0[i] = 45
Buf_1[i] = 55
📌 Mode 2: Normal Market (High Volatility)
If Bollinger Bands are not flat, it displays the standard Stochastic Oscillator:
Buf_0[i] = %K
Buf_1[i] = %D
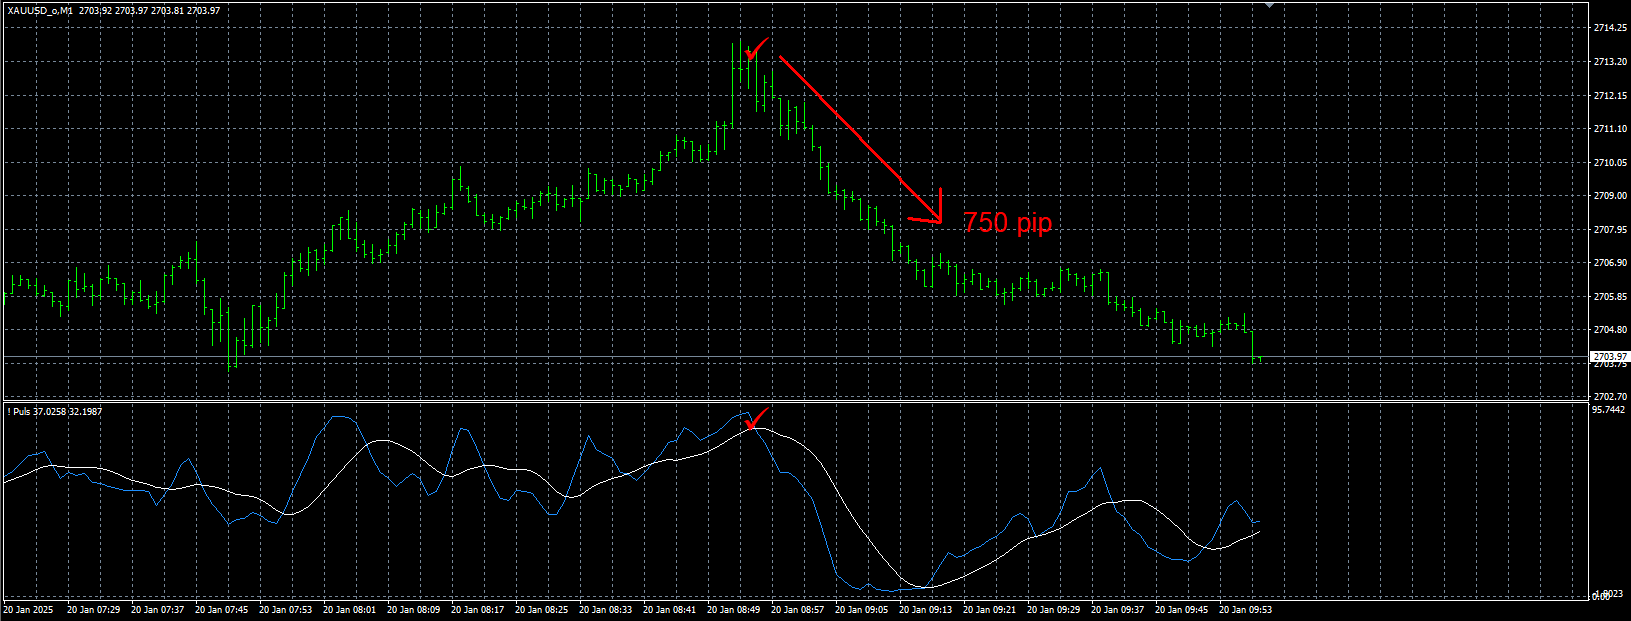
🔴 How to Use This Indicator
📈 Buy Signals (Low Volatility Mode)
When %K (blue) jumps to 55 and %D (white) drops to 45 → Potential Buy
Confirmation:
Price near lower Bollinger Band
RSI/Price Action supports reversal
📉 Sell Signals (Low Volatility Mode)
When %K (blue) drops to 45 and %D (white) rises to 55 → Potential Sell
Confirmation:
Price near upper Bollinger Band
Bearish candlestick patterns
🔄 Normal Market Mode (Standard Stochastic Rules)
Buy: %K crosses above %D (in oversold zone, e.g., below 20).
Sell: %K crosses below %D (in overbought zone, e.g., above 80).
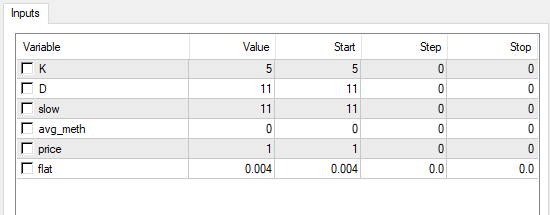
⚙️ Input Parameters
ParameterDefaultDescription
K5Fast %K period
D11Slow %D period
slow11Stochastic smoothing
avg_meth0 (SMA)MA calculation method
price1 (Close)Price source for Stochastic
flat0.004Bollinger Bands flatness threshold
📌 Practical Trading Tips
✅ Best Timeframes: M15-H4 (works well in ranging & trending markets).
✅ Best Pairs: Forex majors (EURUSD, GBPUSD) & indices.
✅ Combine With:
Candlestick patterns (Doji, Engulfing)
Support/Resistance levels
RSI divergence for stronger confirmation.
⚠️ Limitations:
May give false signals in strong trends (use trend filters).
Requires manual confirmation (not a standalone system).
🎯 Conclusion
The Warrior Indicator is a hybrid momentum-volatility tool that:
✔️ Simplifies trading in low-volatility (flat) markets.
✔️ Functions as a standard Stochastic in trending markets.
✔️ Helps spot reversals early when combined with price action.