

Wealth Calculations Indicator - Complete Guide
"Smart Trading Starts with Smart Calculations – Let the Numbers Guide Your Wealth!"
📌 Overview
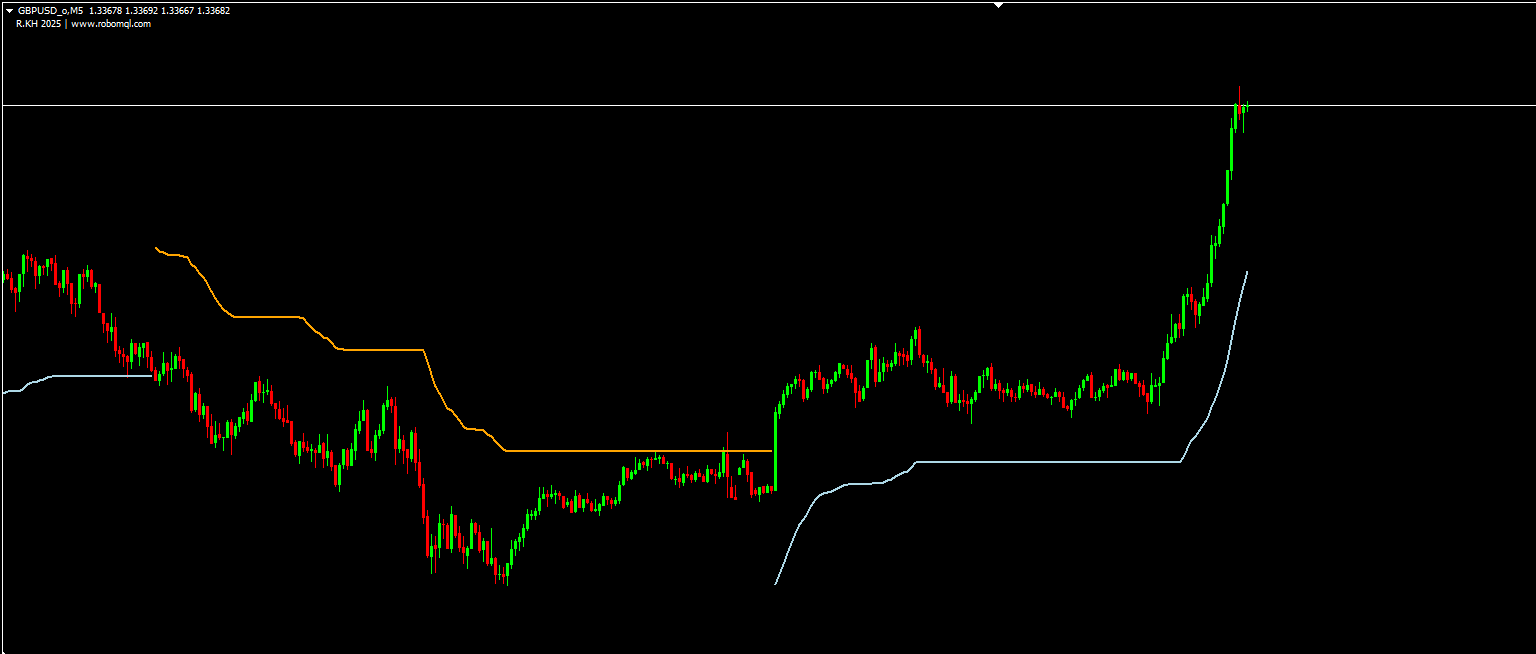
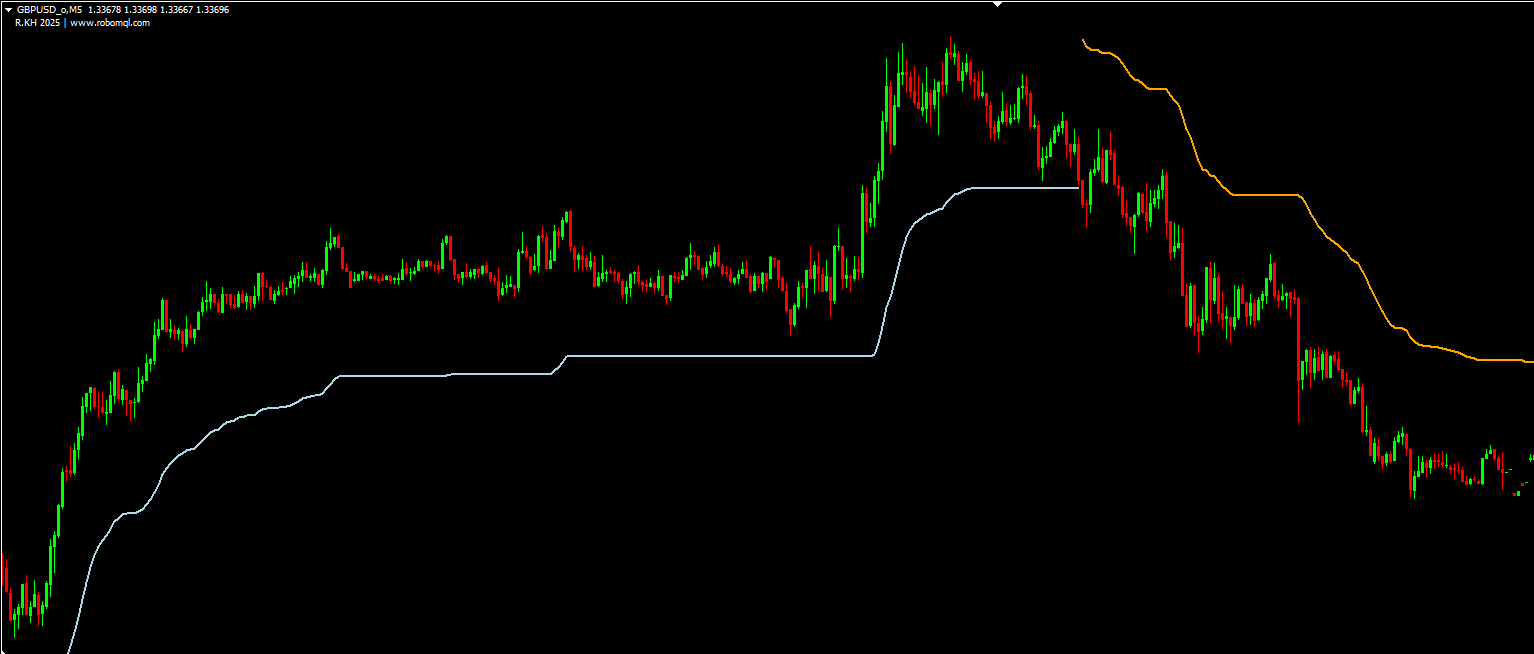
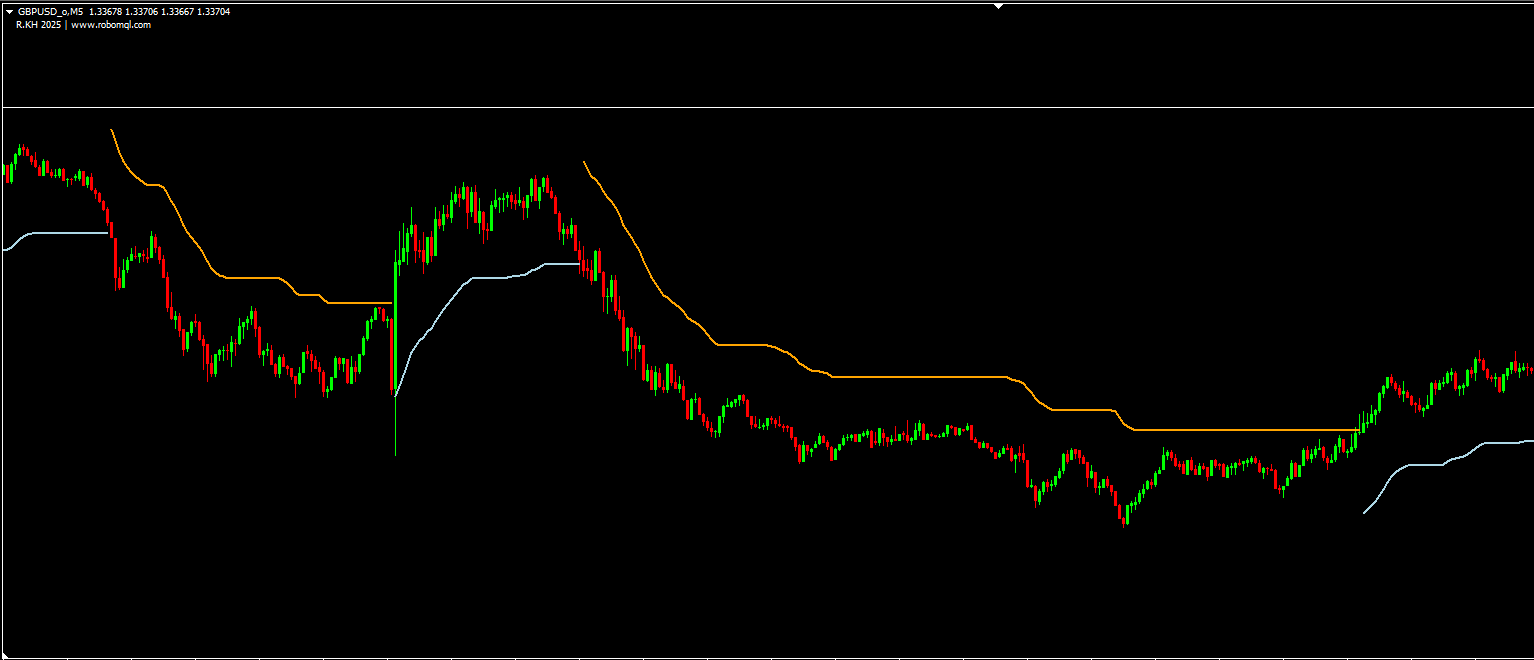
The Wealth Calculations Indicator is a custom MetaTrader 4 (MT4) tool designed to help traders identify trend strength and potential reversals using moving average envelopes and dynamic trend signals. It provides clear visual cues for entry and exit points, making it ideal for trend-following strategies in forex, stocks, and cryptocurrencies.
Key Features:
✅ Trend Identification – Detects bullish/bearish trends using MA envelopes.
✅ Dynamic Support/Resistance – Adjusts levels based on volatility (ATR-based signals).
✅ Customizable Settings – Works across all timeframes and instruments.
✅ Visual & Arrow Signals – Highlights potential reversals with clear markers.
⚙️ How It Works
The indicator uses:
Moving Average Envelopes – Plots upper/lower bands around a central MA.
Trend Confirmation – A trend is confirmed when price closes outside the envelope.
ATR-Based Signals – Optional reversal arrows appear when trends shift.
Indicator Logic:
Bullish Trend = Price closes above upper band → Trend turns UP (Blue line).
Bearish Trend = Price closes below lower band → Trend turns DOWN (Orange line).
Reversal Signals (if enabled) = Arrows mark potential trend changes.
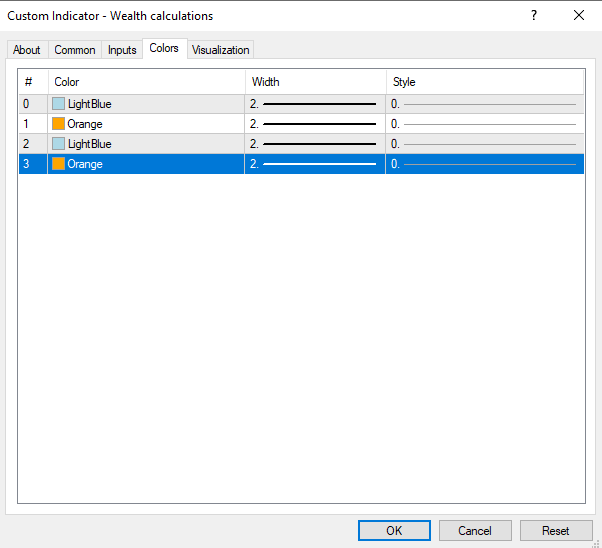
🔧 Indicator Settings
1️⃣ Moving Average Parameters
MA_Period (Default: 14) – Length of the moving average.
MA_Method (Default: 3 = LWMA) – Smoothing type:
0 = SMA | 1 = EMA | 2 = SMMA | 3 = LWMA
Applied_Price (Default: 0 = Close) – Price used for calculations:
0=Close | 1=Open | 2=High | 3=Low | 4=Median
2️⃣ Envelope & Signal Settings
Deviation (Default: 0.2) – Band width (% from MA).
UseSignal (Default: 0 = Off) – Enables ATR-based reversal arrows:
0 = Disabled | 1 = Enabled
📊 How to Use It in Trading
🔹 Trend-Following Strategy
Buy Signal → Price stays above blue line (UpBuffer).
Sell Signal → Price stays below orange line (DnBuffer).
🔹 Reversal Strategy (If UseSignal=1)
Buy Arrow (↑) → Appears when trend shifts from DOWN to UP.
Sell Arrow (↓) → Appears when trend shifts from UP to DOWN.
🔹 Best Practices
✔ Combine with RSI/MACD – Avoid false signals in choppy markets.
✔ Use on H1/D1 – Works best on higher timeframes for stronger trends.
✔ Adjust Deviation – Wider bands reduce noise but may lag.
📌 Final Notes
Works on All Markets – Forex, stocks, crypto, commodities.
Not a Standalone System – Use with stop-loss & risk management.
Optimize Settings – Test different MA_Period & Deviation values.
🔹 Developer & Source
Developer: R.KH (2025)
Website: www.robomql.com
"Trade with Precision – Let Math Build Your Fortune!" 🚀